- Home >
- Stock Photos >
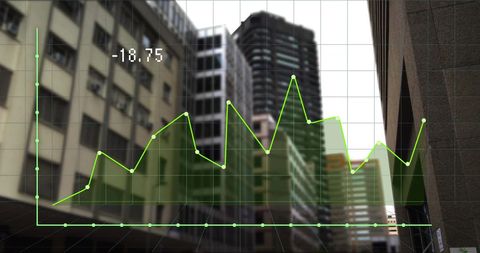
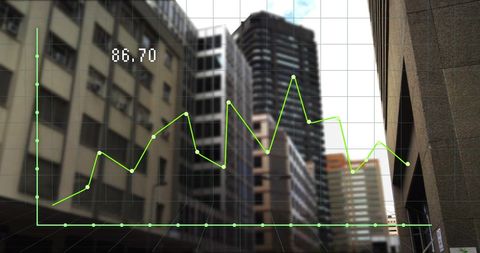
- Dynamic Stock Market Data Analysis Visual and Graph Representation
Dynamic Stock Market Data Analysis Visual and Graph Representation Image

Digitally conceptual design useful for articles, blog posts, presentations about finance, economics, business analysis DrakeAid blogs articles include in background videos explaining finances stats fostering keen interest investors business insights

downloads
Tags:
More
Credit Photo
If you would like to credit the Photo, here are some ways you can do so
Text Link
photo Link
<span class="text-link">
<span>
<a target="_blank" href=https://pikwizard.com/photo/dynamic-stock-market-data-analysis-visual-and-graph-representation/9dd8c27f87bfc6f5bbed17daaa88410d/>PikWizard</a>
</span>
</span>
<span class="image-link">
<span
style="margin: 0 0 20px 0; display: inline-block; vertical-align: middle; width: 100%;"
>
<a
target="_blank"
href="https://pikwizard.com/photo/dynamic-stock-market-data-analysis-visual-and-graph-representation/9dd8c27f87bfc6f5bbed17daaa88410d/"
style="text-decoration: none; font-size: 10px; margin: 0;"
>
<img src="https://pikwizard.com/pw/medium/9dd8c27f87bfc6f5bbed17daaa88410d.jpg" style="margin: 0; width: 100%;" alt="" />
<p style="font-size: 12px; margin: 0;">PikWizard</p>
</a>
</span>
</span>
Free (free of charge)
Free for personal and commercial use.
Author: People Creations