- Home >
- Stock Photos >
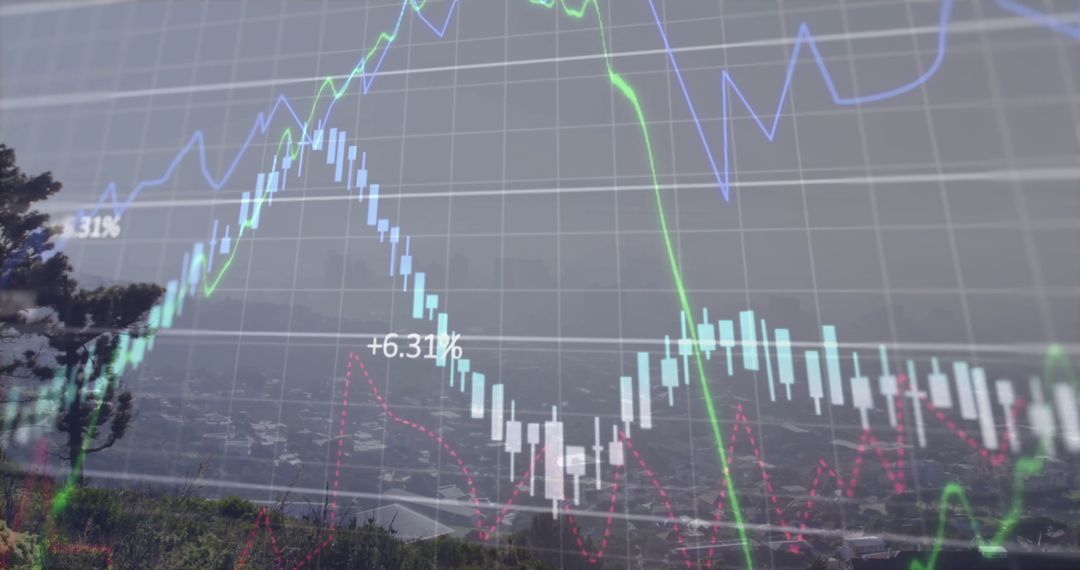
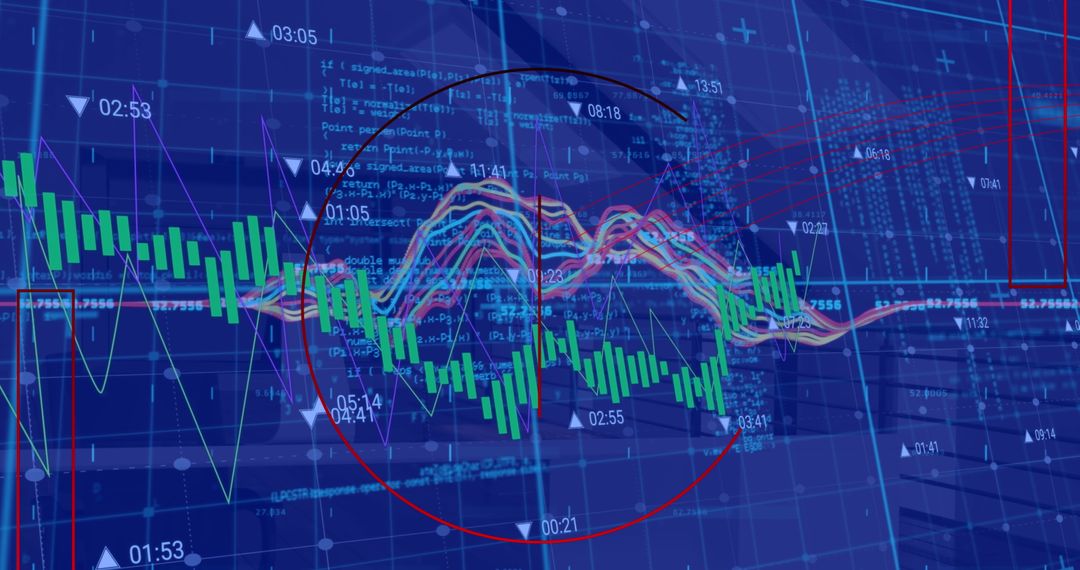
- Dynamic Stock Market Data and Charts on Digital Interface
Dynamic Stock Market Data and Charts on Digital Interface Image

Stock market data and digitized charts intersect over a dark background, representing global financial trends. The interface suggests analyzing business data and monitoring financial markets efficiently. This is ideal for use in presentations, financial reports, or articles about data processing, global markets, or investment strategies.
Powered by 


2
downloads
downloads
Tags:
More
Credit Photo
If you would like to credit the Photo, here are some ways you can do so
Text Link
photo Link
<span class="text-link">
<span>
<a target="_blank" href=https://pikwizard.com/photo/dynamic-stock-market-data-and-charts-on-digital-interface/6986c0263b1a2faf3f7304476b835ae6/>PikWizard</a>
</span>
</span>
<span class="image-link">
<span
style="margin: 0 0 20px 0; display: inline-block; vertical-align: middle; width: 100%;"
>
<a
target="_blank"
href="https://pikwizard.com/photo/dynamic-stock-market-data-and-charts-on-digital-interface/6986c0263b1a2faf3f7304476b835ae6/"
style="text-decoration: none; font-size: 10px; margin: 0;"
>
<img src="https://pikwizard.com/pw/medium/6986c0263b1a2faf3f7304476b835ae6.jpg" style="margin: 0; width: 100%;" alt="" />
<p style="font-size: 12px; margin: 0;">PikWizard</p>
</a>
</span>
</span>
Free (free of charge)
Free for personal and commercial use.
Author: Authentic Images
Similar Free Stock Images

Premium


Premium


Premium


Premium


Premium


Premium


Premium


Premium


Premium


Premium


Premium


Premium


Premium


Premium


Premium


Premium


Premium


Premium


Premium


Premium


Premium


Premium


Premium


Premium