- Home >
- Stock Photos >
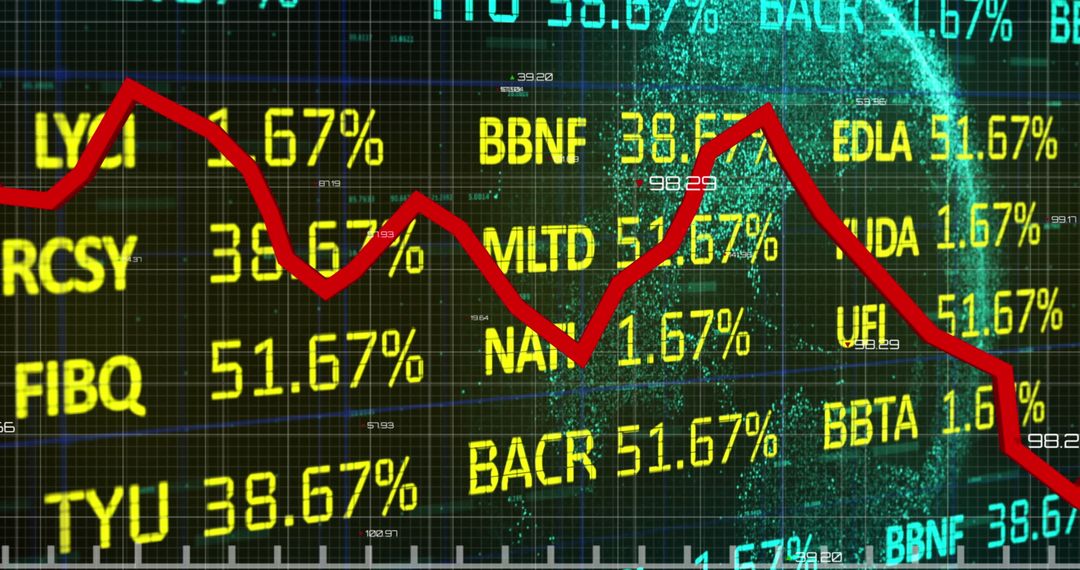
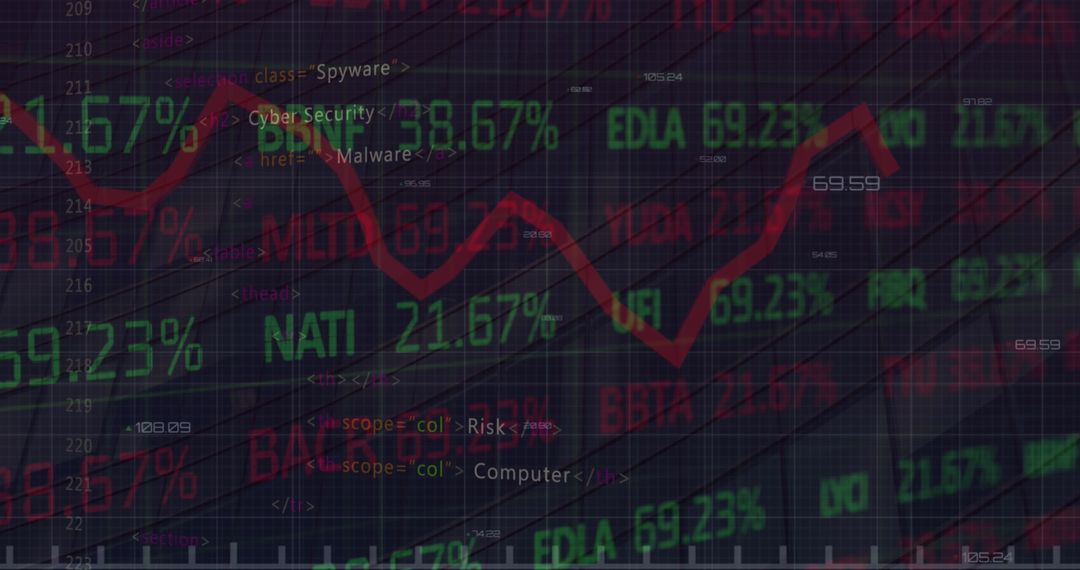
- Dynamic Stock Market Data Display in Red and Green Ticker
Dynamic Stock Market Data Display in Red and Green Ticker Image

Perfect for illustrating financial news, articles about stock market trends, or as a background for business presentations. This image can also be used in contexts discussing trading platforms, investments, technology in finance, or economic analysis.
Powered by 


2
downloads
downloads
Tags:
More
Credit Photo
If you would like to credit the Photo, here are some ways you can do so
Text Link
photo Link
<span class="text-link">
<span>
<a target="_blank" href=https://pikwizard.com/photo/dynamic-stock-market-data-display-in-red-and-green-ticker/e469fbd50377276d3fd560e5540ab54d/>PikWizard</a>
</span>
</span>
<span class="image-link">
<span
style="margin: 0 0 20px 0; display: inline-block; vertical-align: middle; width: 100%;"
>
<a
target="_blank"
href="https://pikwizard.com/photo/dynamic-stock-market-data-display-in-red-and-green-ticker/e469fbd50377276d3fd560e5540ab54d/"
style="text-decoration: none; font-size: 10px; margin: 0;"
>
<img src="https://pikwizard.com/pw/medium/e469fbd50377276d3fd560e5540ab54d.jpg" style="margin: 0; width: 100%;" alt="" />
<p style="font-size: 12px; margin: 0;">PikWizard</p>
</a>
</span>
</span>
Free (free of charge)
Free for personal and commercial use.
Author: People Creations
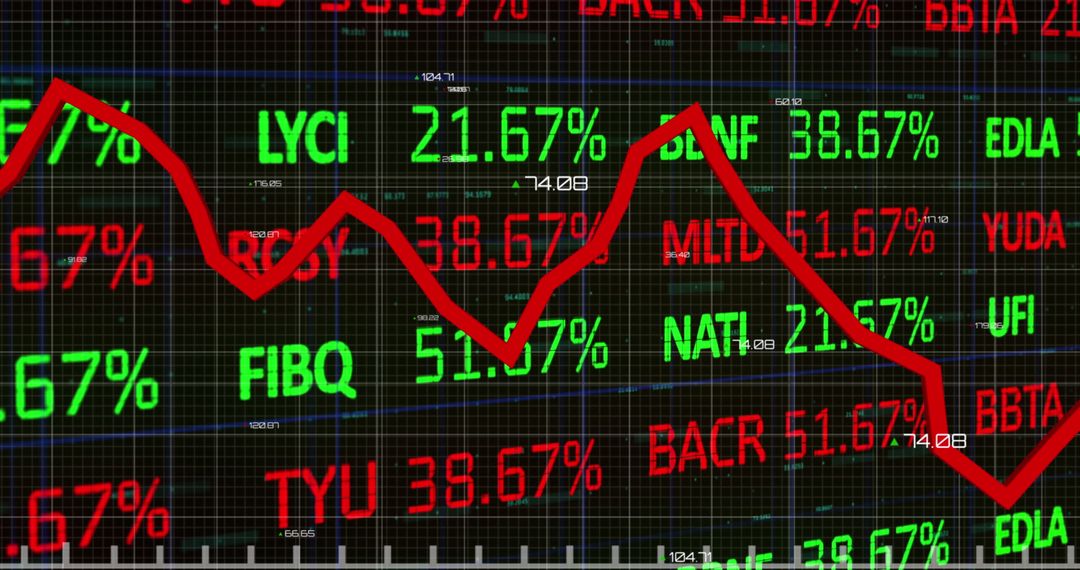
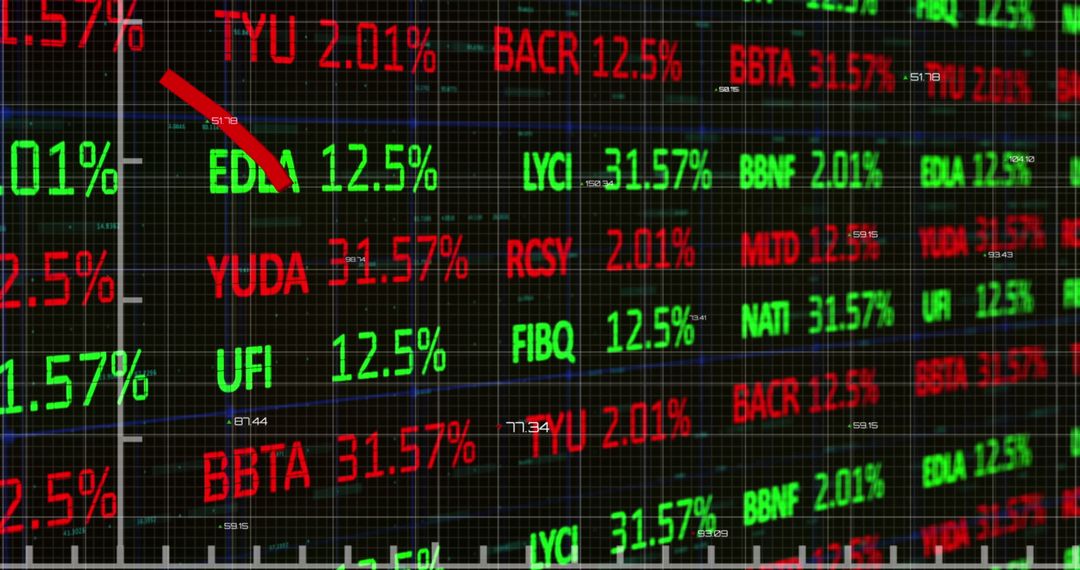
Similar Free Stock Images

Premium


Premium


Premium


Premium


Premium


Premium


Premium


Premium


Premium


Premium


Premium


Premium


Premium


Premium


Premium


Premium


Premium


Premium


Premium


Premium


Premium


Premium


Premium


Premium