- Home >
- Stock Photos >
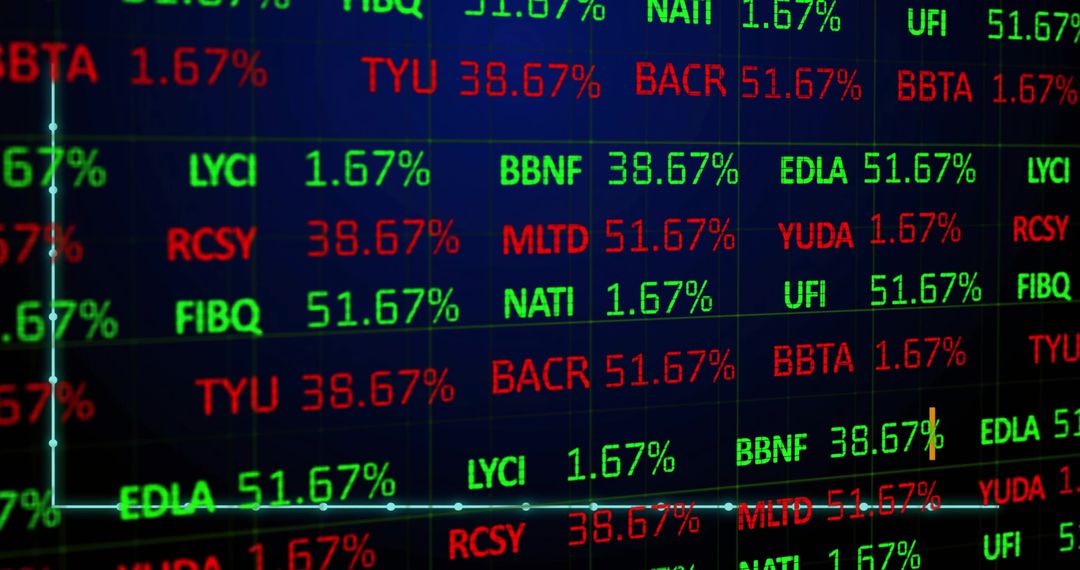
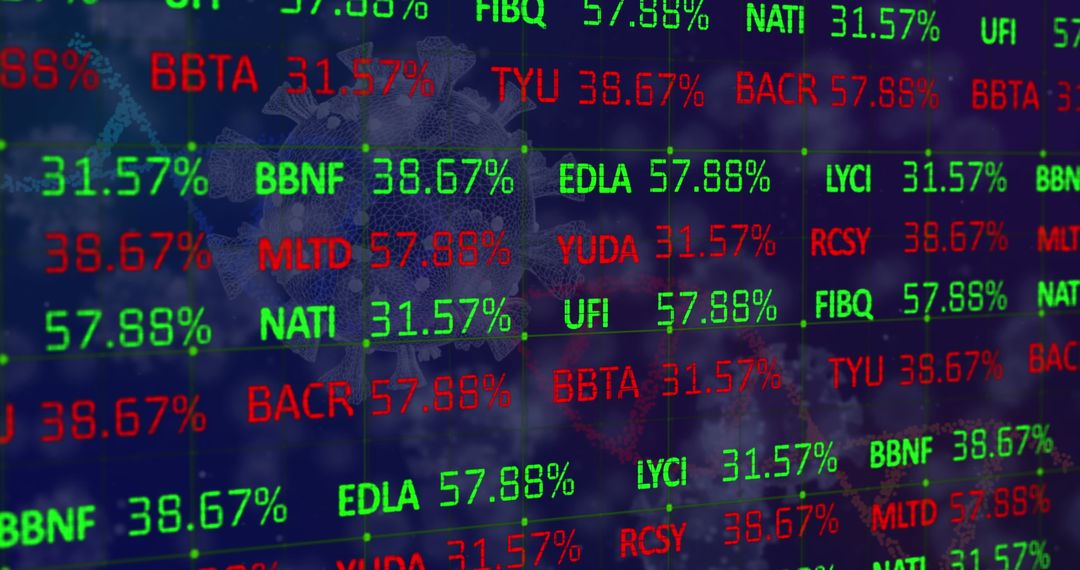
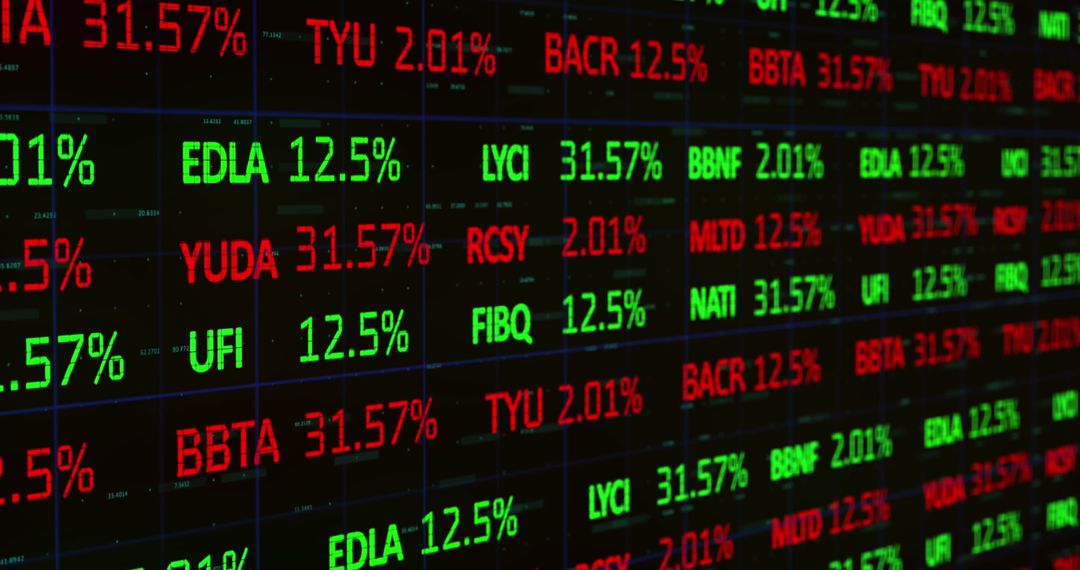
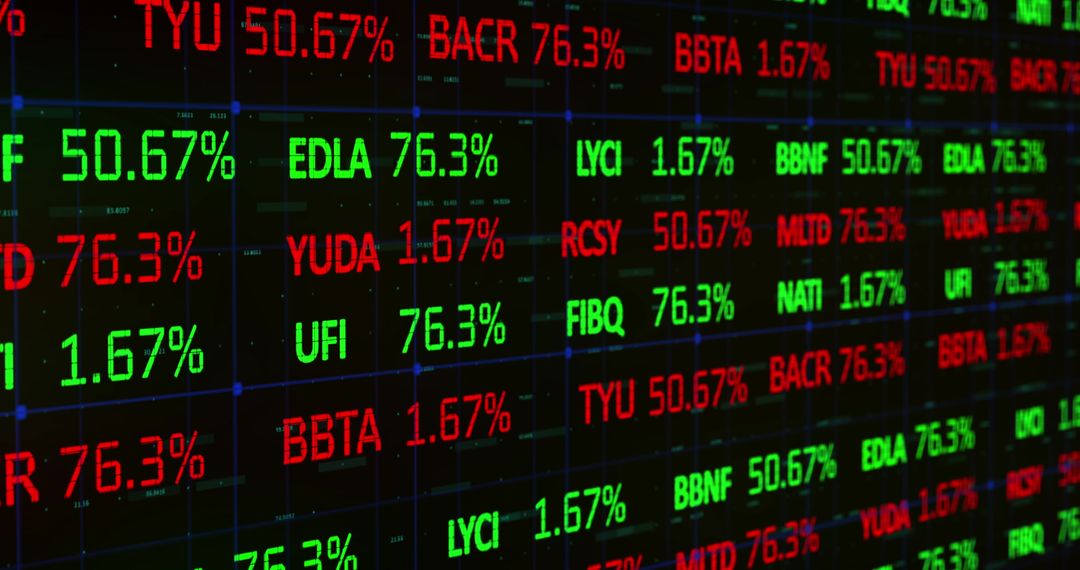
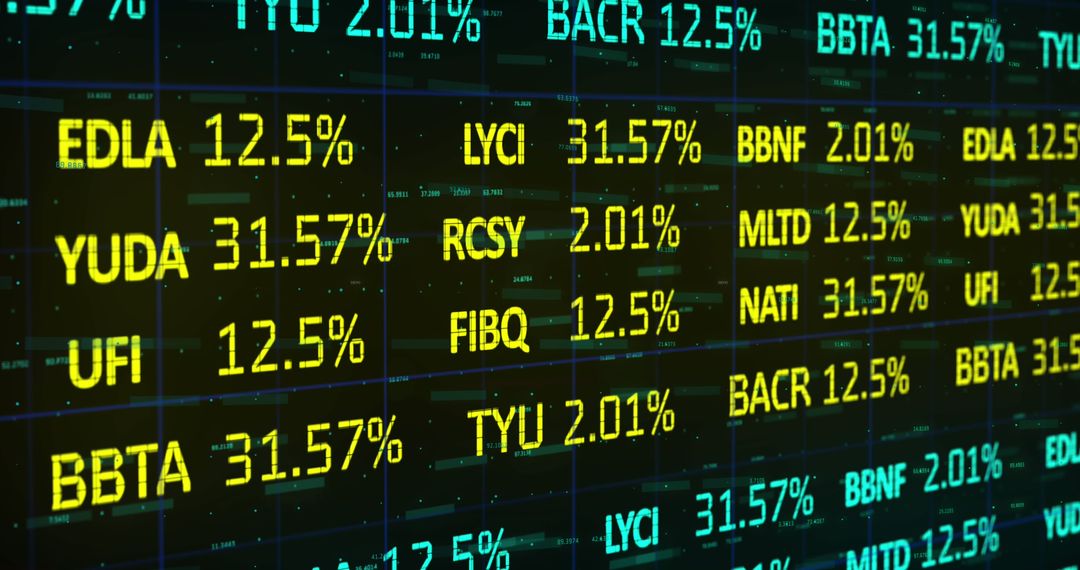
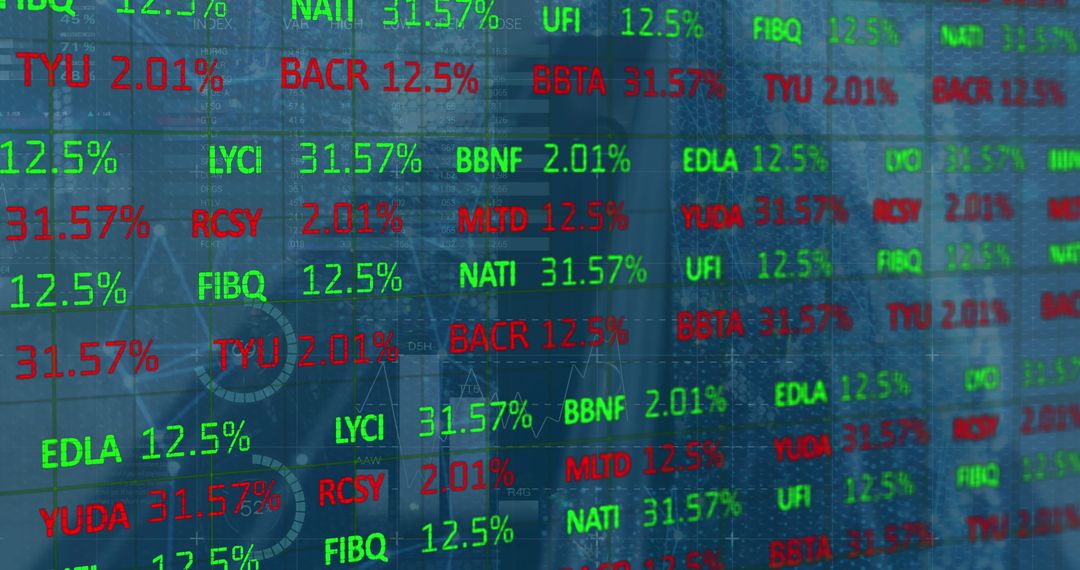
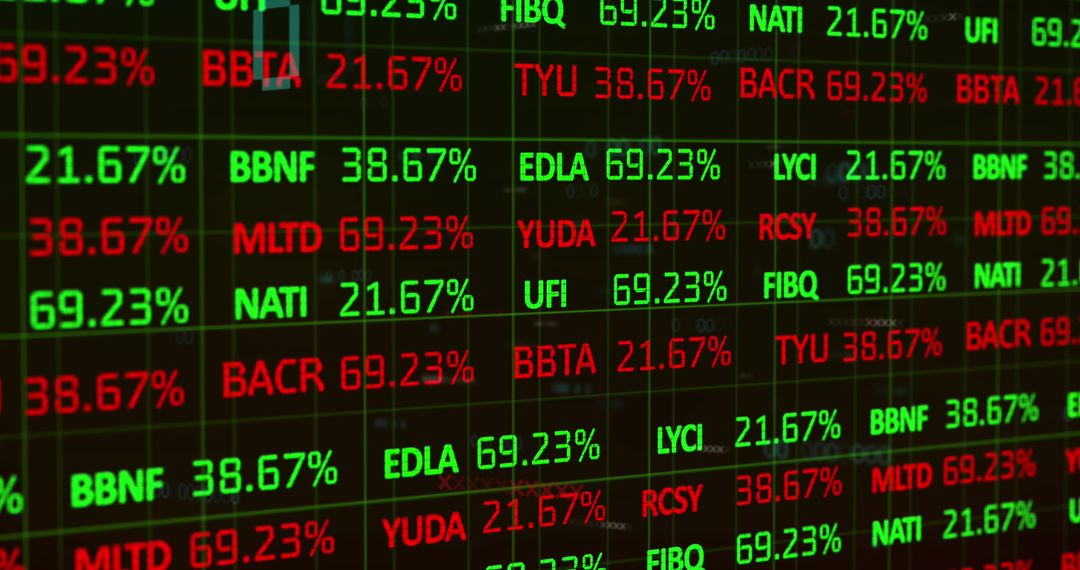
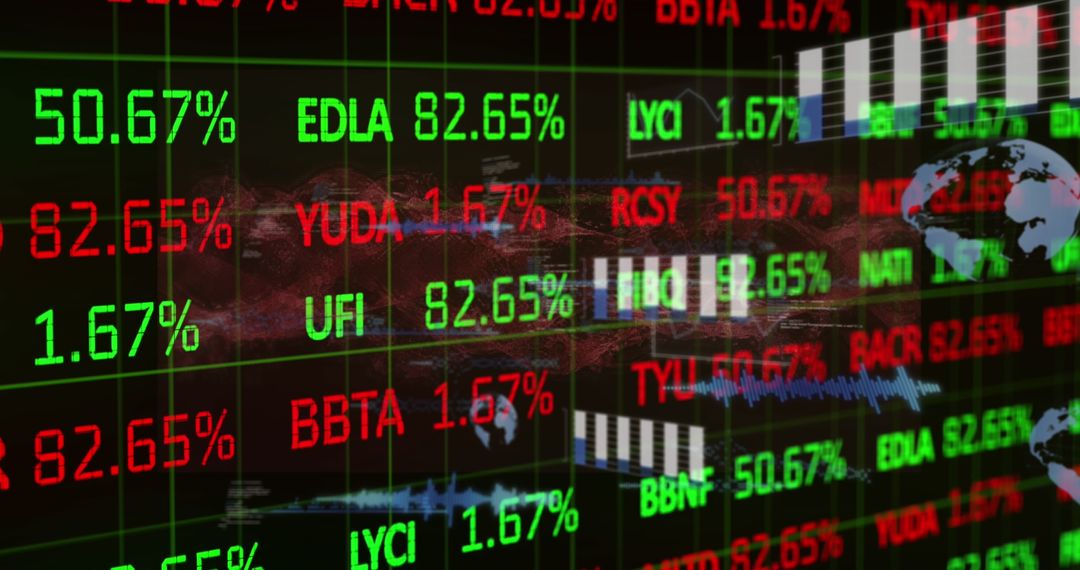
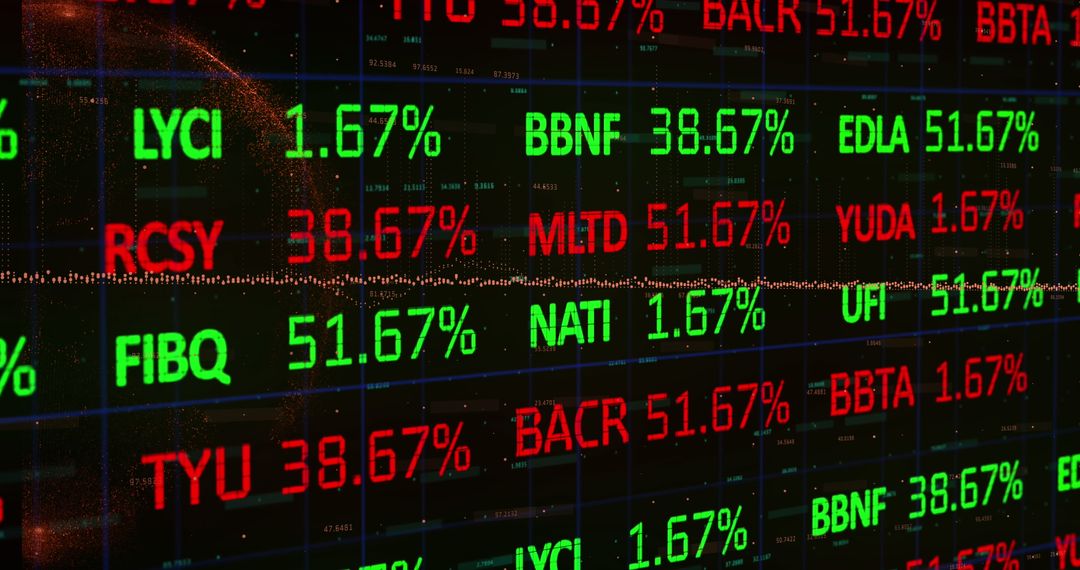
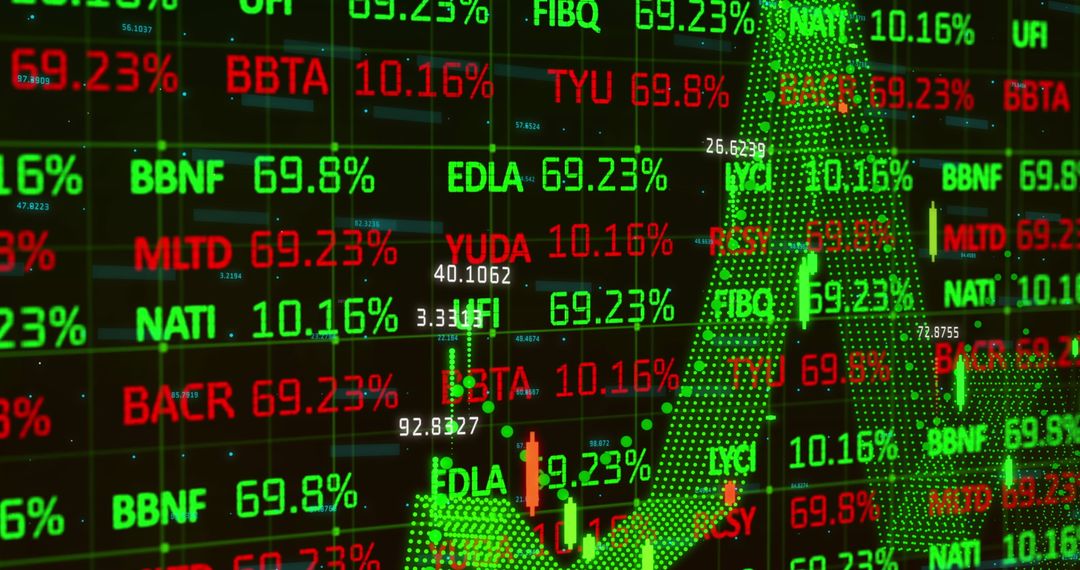
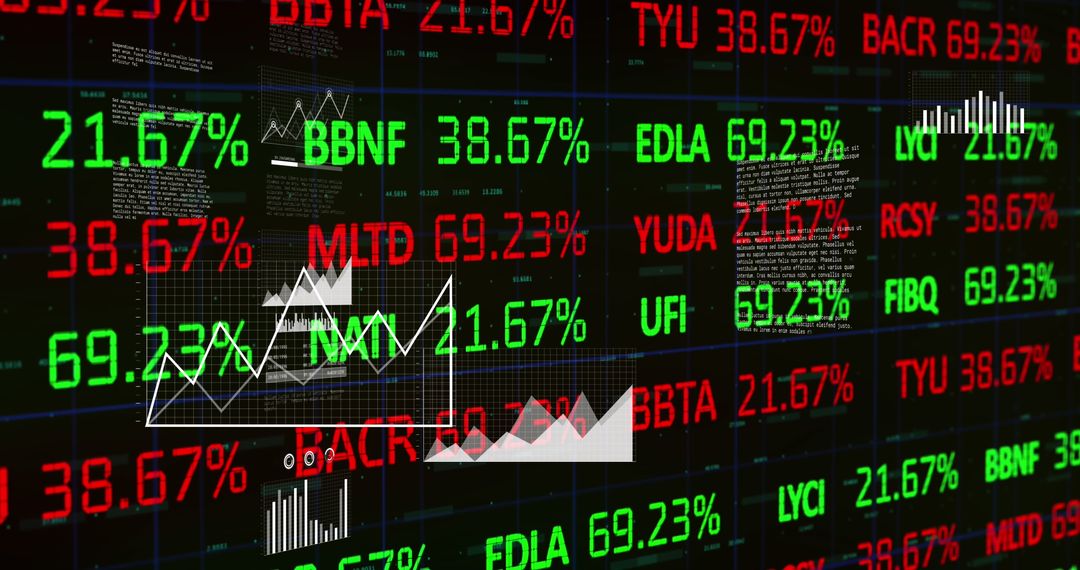
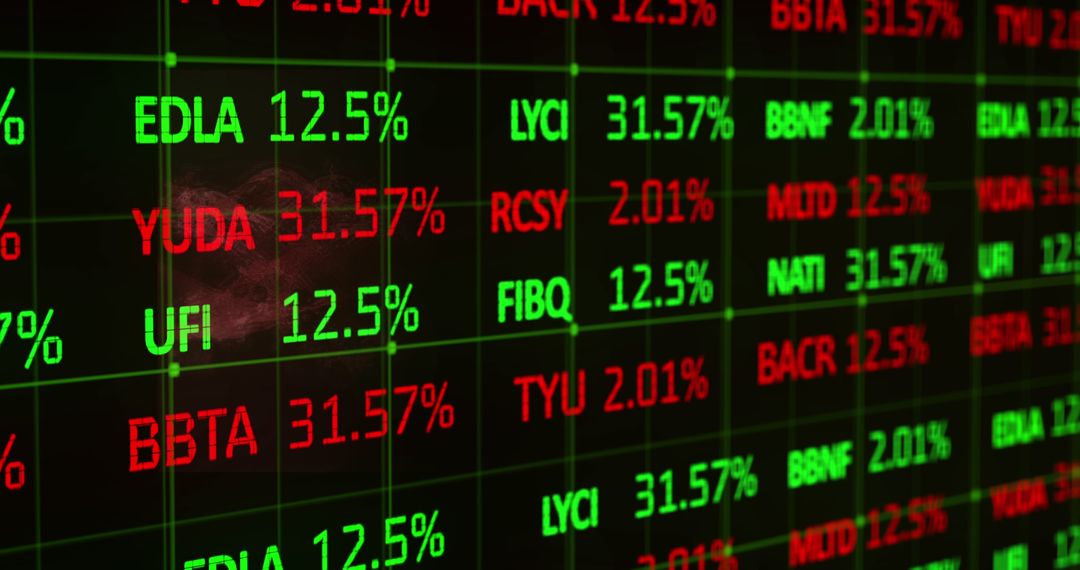
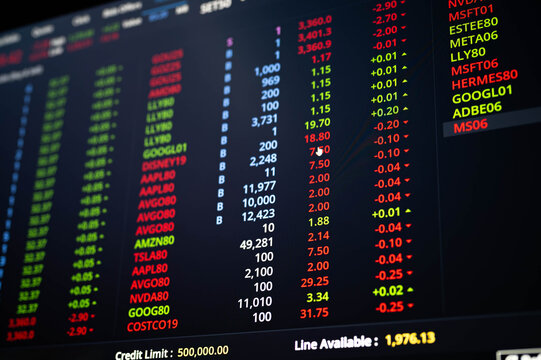
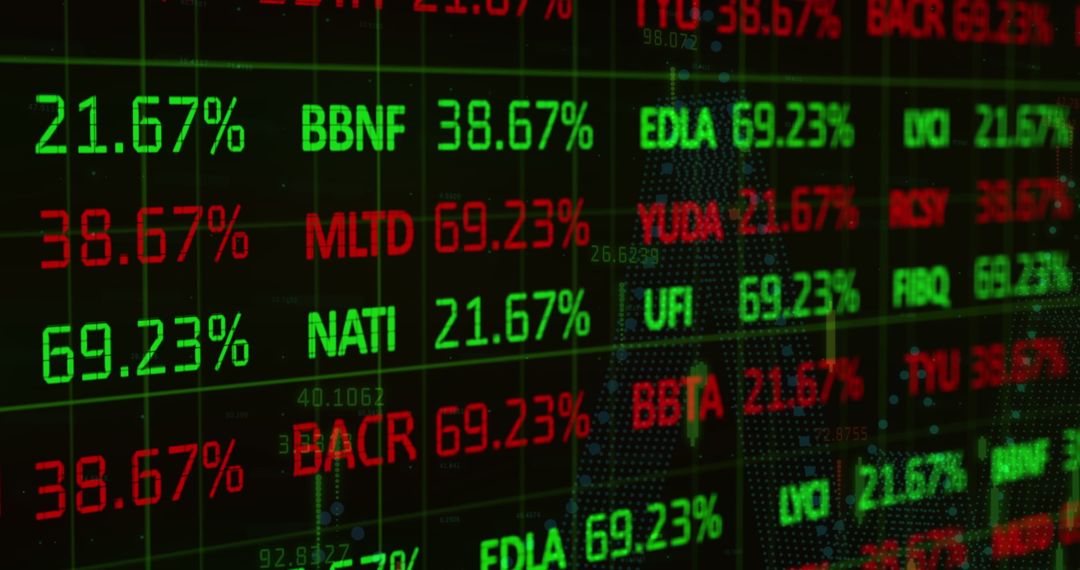
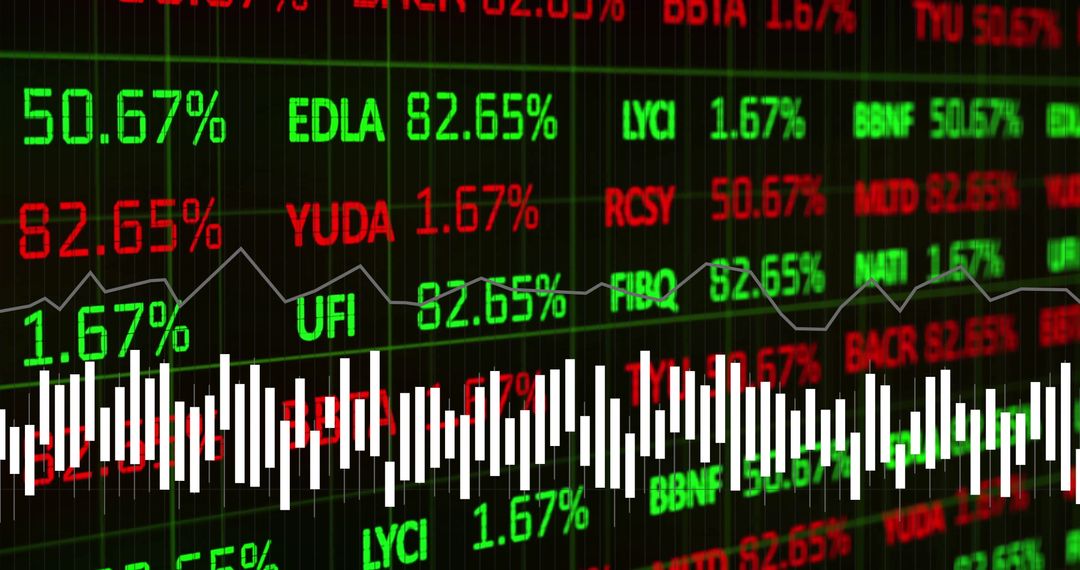
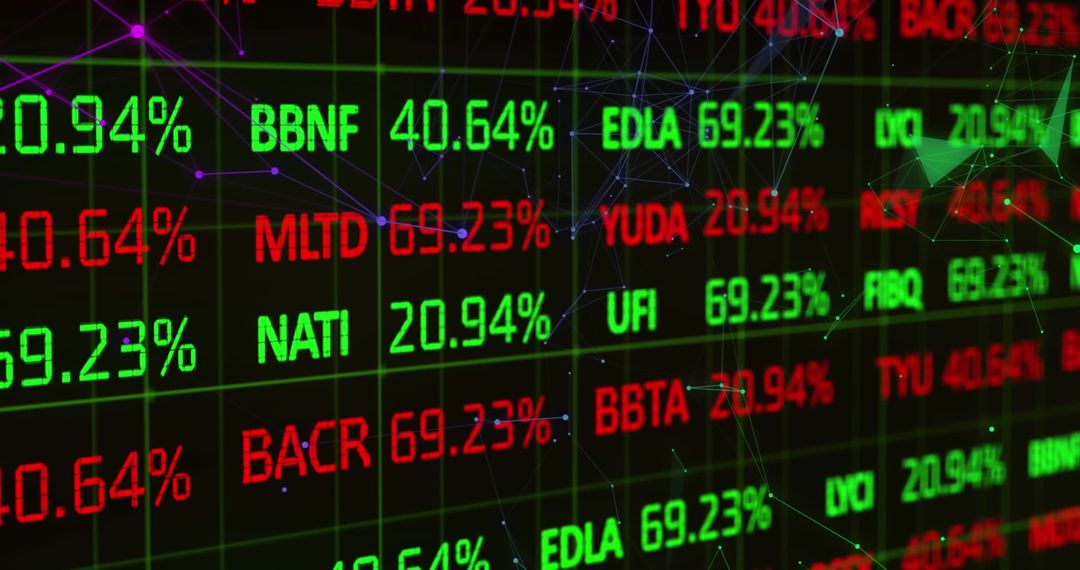
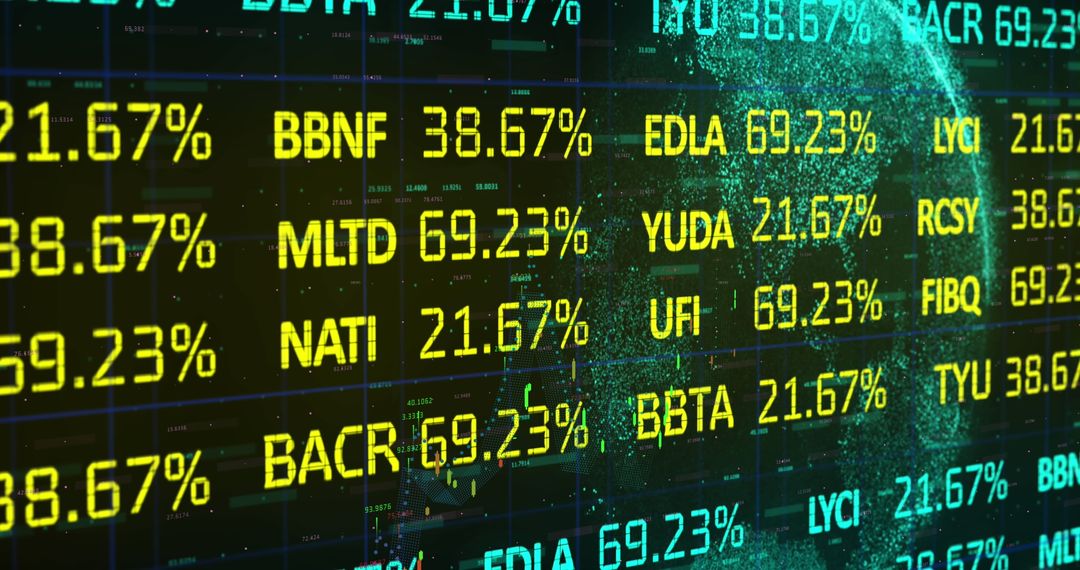
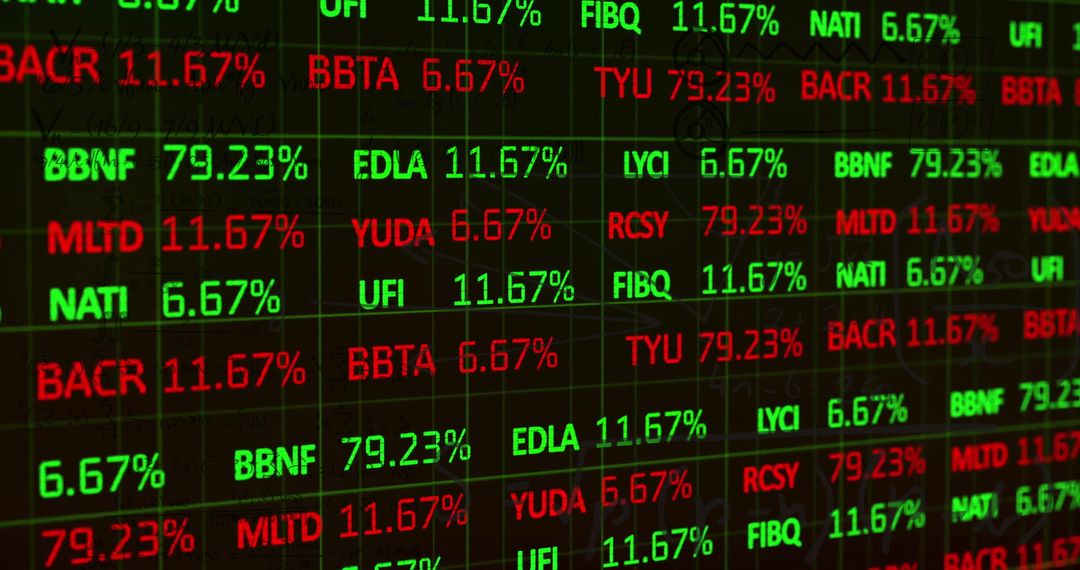
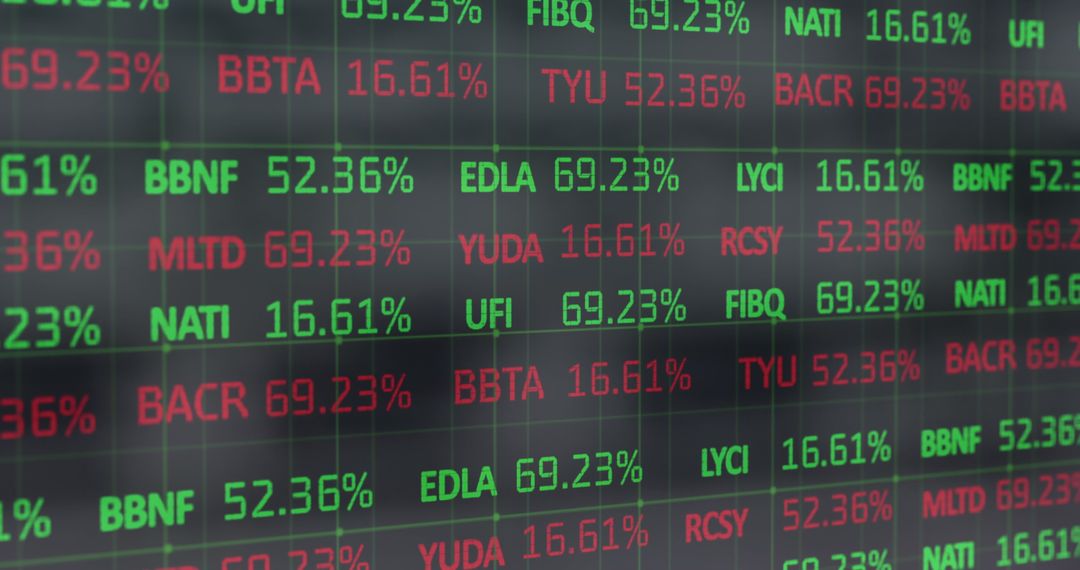
- Dynamic Stock Market Data Display in Red and Green
Dynamic Stock Market Data Display in Red and Green Image

Visual representation of stock market activities with rolling data in red and green illuminated these numbers depicts trading fluctuations, suitable for illustrating concepts in financial news articles, economic studies, presentations on stock market trends and fluctuations, and educational content on finance and investments.
Powered by 


2
downloads
downloads
Tags:
More
Credit Photo
If you would like to credit the Photo, here are some ways you can do so
Text Link
photo Link
<span class="text-link">
<span>
<a target="_blank" href=https://pikwizard.com/photo/dynamic-stock-market-data-display-in-red-and-green/77d57d8e24f0c49f2522f30618e5c2fb/>PikWizard</a>
</span>
</span>
<span class="image-link">
<span
style="margin: 0 0 20px 0; display: inline-block; vertical-align: middle; width: 100%;"
>
<a
target="_blank"
href="https://pikwizard.com/photo/dynamic-stock-market-data-display-in-red-and-green/77d57d8e24f0c49f2522f30618e5c2fb/"
style="text-decoration: none; font-size: 10px; margin: 0;"
>
<img src="https://pikwizard.com/pw/medium/77d57d8e24f0c49f2522f30618e5c2fb.jpg" style="margin: 0; width: 100%;" alt="" />
<p style="font-size: 12px; margin: 0;">PikWizard</p>
</a>
</span>
</span>
Free (free of charge)
Free for personal and commercial use.
Author: Creative Art
Similar Free Stock Images

Premium


Premium


Premium


Premium


Premium


Premium


Premium


Premium


Premium


Premium


Premium


Premium


Premium


Premium


Premium


Premium


Premium


Premium


Premium


Premium


Premium


Premium


Premium


Premium