- Home >
- Stock Photos >
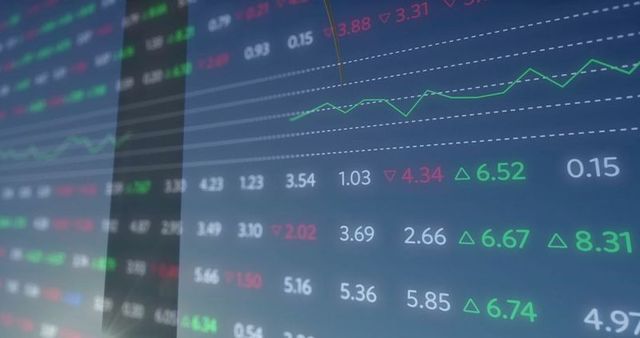
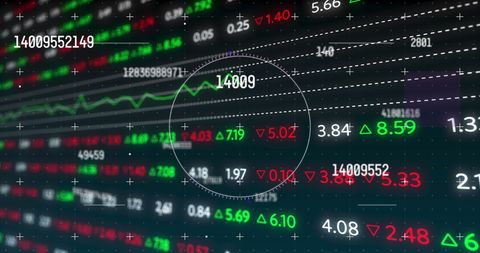
- Dynamic Stock Market Data Display with Graphs and Numbers
Dynamic Stock Market Data Display with Graphs and Numbers Image

The image depicts a vibrant display of stock market data, including numerical figures and graph lines representing financial fluctuations. Typically associated with a bustling trading floor, this type of digital overlay is highly relevant in the fields of finance and trading. Suitable for use in content related to economic news, financial reports, investment analysis, or banking technology advancements.
Powered by  - Get 15% off with code: PIKWIZARD15


downloads
Tags:
More
Credit Photo
If you would like to credit the Photo, here are some ways you can do so
Text Link
photo Link
<span class="text-link">
<span>
<a target="_blank" href=https://pikwizard.com/photo/dynamic-stock-market-data-display-with-graphs-and-numbers/f5783a736e3e4bf9e831c8afcabef1c0/>PikWizard</a>
</span>
</span>
<span class="image-link">
<span
style="margin: 0 0 20px 0; display: inline-block; vertical-align: middle; width: 100%;"
>
<a
target="_blank"
href="https://pikwizard.com/photo/dynamic-stock-market-data-display-with-graphs-and-numbers/f5783a736e3e4bf9e831c8afcabef1c0/"
style="text-decoration: none; font-size: 10px; margin: 0;"
>
<img src="https://pikwizard.com/pw/medium/f5783a736e3e4bf9e831c8afcabef1c0.jpg" style="margin: 0; width: 100%;" alt="" />
<p style="font-size: 12px; margin: 0;">PikWizard</p>
</a>
</span>
</span>
Free (free of charge)
Free for personal and commercial use.
Author: Awesome Content
Similar Free Stock Images
Loading...

Premium


Premium


Premium


Premium


Premium

Premium


Premium


Premium

Premium


Premium


Premium


Premium


Premium


Premium


Premium


Premium


Premium


Premium

Premium


Premium

Premium


Premium


Premium


Premium


Premium