- Home >
- Stock Photos >
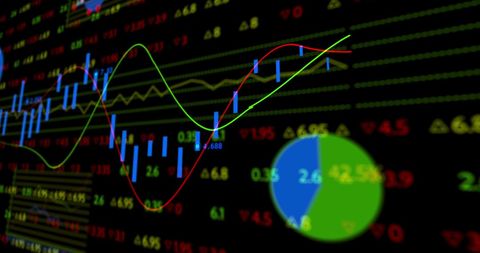
- Dynamic Stock Market Data Display with Vibrant Graph Overlays
Dynamic Stock Market Data Display with Vibrant Graph Overlays Image

Image depicting vibrant stock market data screens with overlapping colorful graphs and charts. Capturing financial trends and analytics, this image is ideal for illustrating concepts related to investing, trading, stock market analysis, financial reports, economic trends, and data-driven decision-making in finance.
Powered by 


downloads
Tags:
More
Credit Photo
If you would like to credit the Photo, here are some ways you can do so
Text Link
photo Link
<span class="text-link">
<span>
<a target="_blank" href=https://pikwizard.com/photo/dynamic-stock-market-data-display-with-vibrant-graph-overlays/17822c6b99882eab3ec074a8e99f838c/>PikWizard</a>
</span>
</span>
<span class="image-link">
<span
style="margin: 0 0 20px 0; display: inline-block; vertical-align: middle; width: 100%;"
>
<a
target="_blank"
href="https://pikwizard.com/photo/dynamic-stock-market-data-display-with-vibrant-graph-overlays/17822c6b99882eab3ec074a8e99f838c/"
style="text-decoration: none; font-size: 10px; margin: 0;"
>
<img src="https://pikwizard.com/pw/medium/17822c6b99882eab3ec074a8e99f838c.jpg" style="margin: 0; width: 100%;" alt="" />
<p style="font-size: 12px; margin: 0;">PikWizard</p>
</a>
</span>
</span>
Free (free of charge)
Free for personal and commercial use.
Author: Awesome Content
Similar Free Stock Images
Loading...
Premium


Premium


Premium


Premium


Premium


Premium


Premium


Premium


Premium


Premium


Premium


Premium

Premium


Premium

Premium


Premium


Premium


Premium


Premium

Premium

Premium


Premium


Premium


Premium


Premium