
- Home >
- Stock Photos >
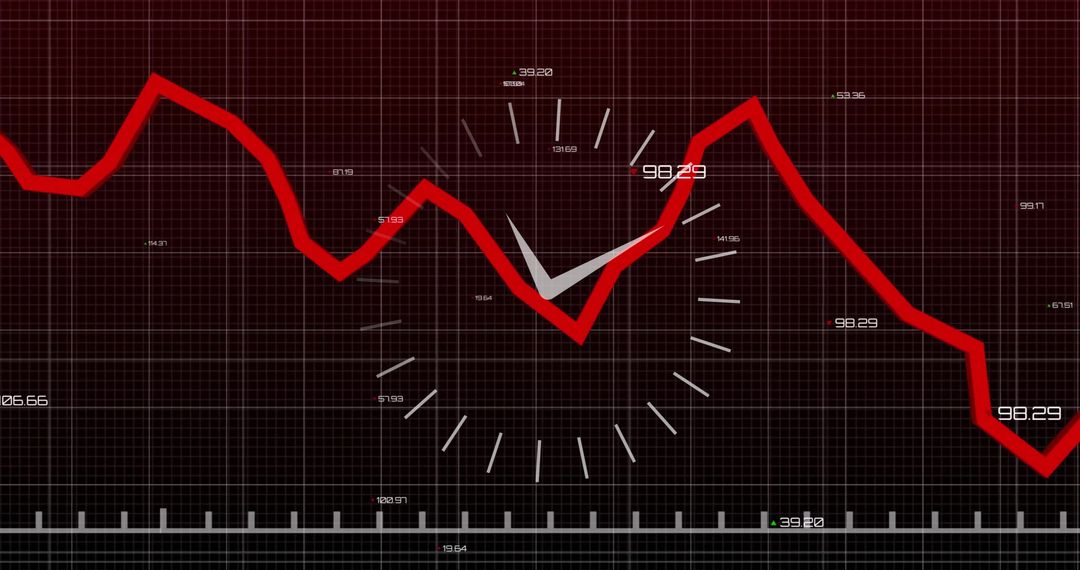
- Dynamic Stock Market Data on Graphical Display
Dynamic Stock Market Data on Graphical Display Image

Shows a sophisticated visualization of stock market data with dials and charts. Represents performance and analytics, ideal for topics related to finance, investment insights, business strategy, and market research. Useful for presentations, articles about economic trends, financial apps, and educational content focusing on investment analytics.
Powered by  - Get 15% off with code: PIKWIZARD15


2
downloads
downloads
Tags:
More
Credit Photo
If you would like to credit the Photo, here are some ways you can do so
Text Link
photo Link
<span class="text-link">
<span>
<a target="_blank" href=https://pikwizard.com/photo/dynamic-stock-market-data-on-graphical-display/b27fa6e141d57e6d73a30b6f776e96b7/>PikWizard</a>
</span>
</span>
<span class="image-link">
<span
style="margin: 0 0 20px 0; display: inline-block; vertical-align: middle; width: 100%;"
>
<a
target="_blank"
href="https://pikwizard.com/photo/dynamic-stock-market-data-on-graphical-display/b27fa6e141d57e6d73a30b6f776e96b7/"
style="text-decoration: none; font-size: 10px; margin: 0;"
>
<img src="https://pikwizard.com/pw/medium/b27fa6e141d57e6d73a30b6f776e96b7.jpg" style="margin: 0; width: 100%;" alt="" />
<p style="font-size: 12px; margin: 0;">PikWizard</p>
</a>
</span>
</span>
Free (free of charge)
Free for personal and commercial use.
Author: People Creations
Similar Free Stock Images

Premium


Premium


Premium


Premium


Premium


Premium


Premium


Premium


Premium


Premium


Premium


Premium


Premium


Premium


Premium


Premium


Premium


Premium


Premium


Premium


Premium


Premium


Premium


Premium

