- Home >
- Stock Photos >
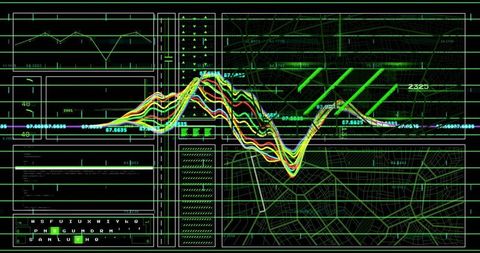
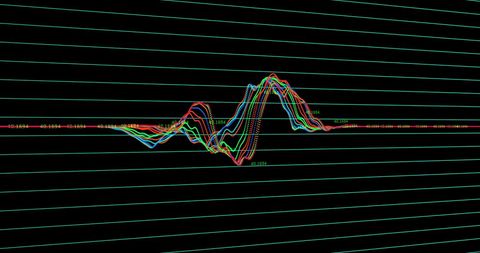
- Dynamic Stock Market Data Visualization for Financial Analysis
Dynamic Stock Market Data Visualization for Financial Analysis Image

Illustrates detailed visualization of stock market analysis combining fluctuating lijnvan graphs and dense data text. Usable for articles, presentations or blog posts focused on financial terminology, dynamic dependency on coding, corporate events, news segmentation.

downloads
Tags:
More
Credit Photo
If you would like to credit the Photo, here are some ways you can do so
Text Link
photo Link
<span class="text-link">
<span>
<a target="_blank" href=https://pikwizard.com/photo/dynamic-stock-market-data-visualization-for-financial-analysis/829e01f08f357bc57aeb15c29de79dae/>PikWizard</a>
</span>
</span>
<span class="image-link">
<span
style="margin: 0 0 20px 0; display: inline-block; vertical-align: middle; width: 100%;"
>
<a
target="_blank"
href="https://pikwizard.com/photo/dynamic-stock-market-data-visualization-for-financial-analysis/829e01f08f357bc57aeb15c29de79dae/"
style="text-decoration: none; font-size: 10px; margin: 0;"
>
<img src="https://pikwizard.com/pw/medium/829e01f08f357bc57aeb15c29de79dae.jpg" style="margin: 0; width: 100%;" alt="" />
<p style="font-size: 12px; margin: 0;">PikWizard</p>
</a>
</span>
</span>
Free (free of charge)
Free for personal and commercial use.
Author: Authentic Images