- Home >
- Stock Photos >
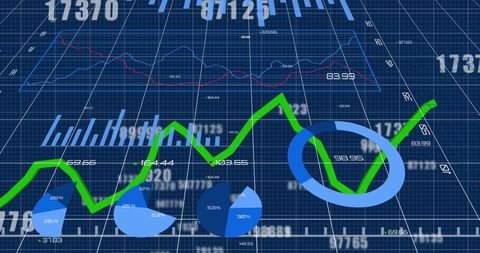
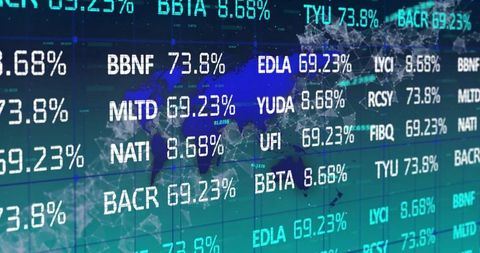
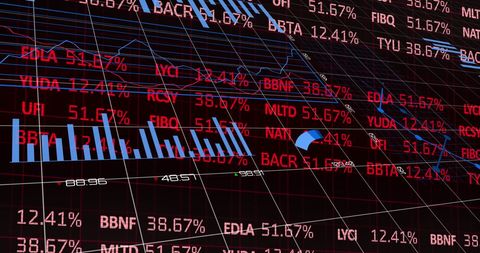
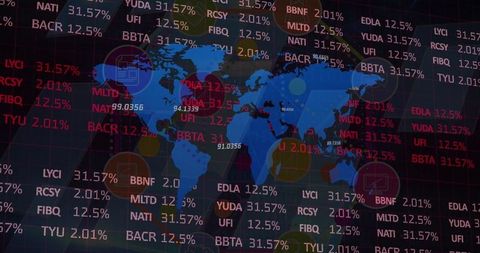
- Dynamic Stock Market Data Visualization on Black Background
Dynamic Stock Market Data Visualization on Black Background Image
This digital depiction of stock market data shows intricate charts with fluctuating values on a vivid black background. Useful for presentations on financial trends, investment analysis, or educational resources about trading and economics.

downloads
Tags:
More
Credit Photo
If you would like to credit the Photo, here are some ways you can do so
Text Link
photo Link
<span class="text-link">
<span>
<a target="_blank" href=https://pikwizard.com/photo/dynamic-stock-market-data-visualization-on-black-background/b7dffa449832e5e98682d14b676835f9/>PikWizard</a>
</span>
</span>
<span class="image-link">
<span
style="margin: 0 0 20px 0; display: inline-block; vertical-align: middle; width: 100%;"
>
<a
target="_blank"
href="https://pikwizard.com/photo/dynamic-stock-market-data-visualization-on-black-background/b7dffa449832e5e98682d14b676835f9/"
style="text-decoration: none; font-size: 10px; margin: 0;"
>
<img src="https://pikwizard.com/pw/medium/b7dffa449832e5e98682d14b676835f9.jpg" style="margin: 0; width: 100%;" alt="" />
<p style="font-size: 12px; margin: 0;">PikWizard</p>
</a>
</span>
</span>
Free (free of charge)
Free for personal and commercial use.
Author: Authentic Images