
- Home >
- Stock Photos >
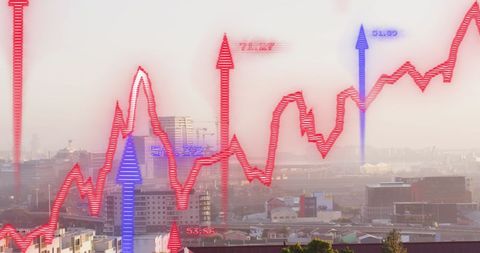
- Dynamic Stock Market Data Visualization on Digital Interface Background
Dynamic Stock Market Data Visualization on Digital Interface Background Image

Stock market data visualized with rising and falling trends against digital blue interface background. Perfect for use in financial analysis discussions, presentations about market trends, or educational resources on economic dynamics.
Powered by 


downloads
Tags:
More
Credit Photo
If you would like to credit the Photo, here are some ways you can do so
Text Link
photo Link
<span class="text-link">
<span>
<a target="_blank" href=https://pikwizard.com/photo/dynamic-stock-market-data-visualization-on-digital-interface-background/81c9b2bef17b70261e67960ad8f70d20/>PikWizard</a>
</span>
</span>
<span class="image-link">
<span
style="margin: 0 0 20px 0; display: inline-block; vertical-align: middle; width: 100%;"
>
<a
target="_blank"
href="https://pikwizard.com/photo/dynamic-stock-market-data-visualization-on-digital-interface-background/81c9b2bef17b70261e67960ad8f70d20/"
style="text-decoration: none; font-size: 10px; margin: 0;"
>
<img src="https://pikwizard.com/pw/medium/81c9b2bef17b70261e67960ad8f70d20.jpg" style="margin: 0; width: 100%;" alt="" />
<p style="font-size: 12px; margin: 0;">PikWizard</p>
</a>
</span>
</span>
Free (free of charge)
Free for personal and commercial use.
Author: People Creations
Similar Free Stock Images

Premium


Premium

Premium


Premium


Premium


Premium


Premium


Premium

Premium


Premium


Premium


Premium


Premium


Premium


Premium


Premium


Premium

Premium


Premium


Premium


Premium


Premium


Premium


Premium


Premium

Explore More Free Stock Images