- Home >
- Stock Photos >
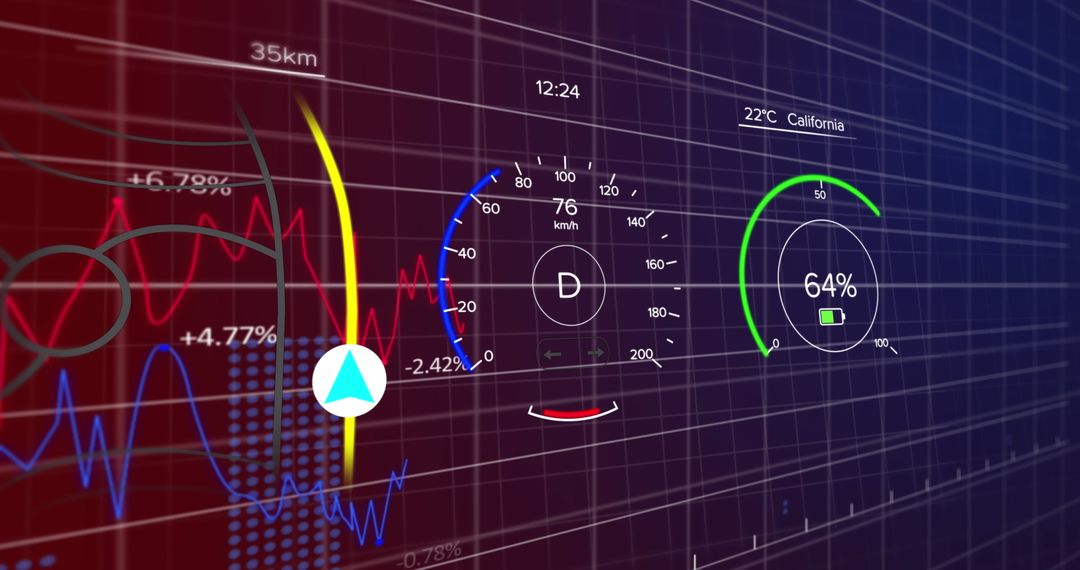
- Dynamic Stock Market Data Visualization on Futuristic Digital Interface
Dynamic Stock Market Data Visualization on Futuristic Digital Interface Image

Dynamic chart with red and blue lines overlays on digital interface captures movement in stock prices or financial analytics. Suitable for use in presentations, reports, articles related to economics, stock market, and financial trends, as well as business strategy or analytical data review.
Powered by  - Get 15% off with code: PIKWIZARD15


0
downloads
downloads
Tags:
More
Credit Photo
If you would like to credit the Photo, here are some ways you can do so
Text Link
photo Link
<span class="text-link">
<span>
<a target="_blank" href=https://pikwizard.com/photo/dynamic-stock-market-data-visualization-on-futuristic-digital-interface/726052742331735fed83094a789cda0d/>PikWizard</a>
</span>
</span>
<span class="image-link">
<span
style="margin: 0 0 20px 0; display: inline-block; vertical-align: middle; width: 100%;"
>
<a
target="_blank"
href="https://pikwizard.com/photo/dynamic-stock-market-data-visualization-on-futuristic-digital-interface/726052742331735fed83094a789cda0d/"
style="text-decoration: none; font-size: 10px; margin: 0;"
>
<img src="https://pikwizard.com/pw/medium/726052742331735fed83094a789cda0d.jpg" style="margin: 0; width: 100%;" alt="" />
<p style="font-size: 12px; margin: 0;">PikWizard</p>
</a>
</span>
</span>
Free (free of charge)
Free for personal and commercial use.
Author: Awesome Content
Similar Free Stock Images

Premium


Premium


Premium


Premium


Premium


Premium


Premium


Premium


Premium


Premium


Premium


Premium


Premium


Premium


Premium


Premium


Premium


Premium


Premium


Premium


Premium


Premium


Premium


Premium