
- Home >
- Stock Photos >
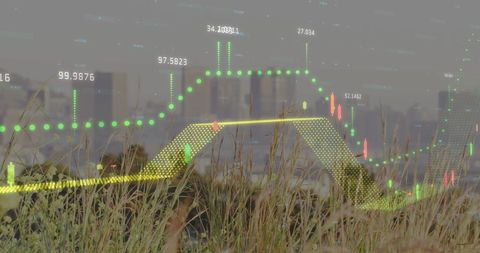
- Dynamic Stock Market Data Visualization on Trading Screen
Dynamic Stock Market Data Visualization on Trading Screen Image

Vibrant digital interface displaying fluctuating stock market data and graphs, suggesting a dynamic trading environment. Suitable for themes related to finance, economics, and data analytics, enhancing content on financial analysis, investment trends, and global market activities.
Powered by 


downloads
Tags:
More
Credit Photo
If you would like to credit the Photo, here are some ways you can do so
Text Link
photo Link
<span class="text-link">
<span>
<a target="_blank" href=https://pikwizard.com/photo/dynamic-stock-market-data-visualization-on-trading-screen/97d10c8bae0a6b7151abf81196ffde41/>PikWizard</a>
</span>
</span>
<span class="image-link">
<span
style="margin: 0 0 20px 0; display: inline-block; vertical-align: middle; width: 100%;"
>
<a
target="_blank"
href="https://pikwizard.com/photo/dynamic-stock-market-data-visualization-on-trading-screen/97d10c8bae0a6b7151abf81196ffde41/"
style="text-decoration: none; font-size: 10px; margin: 0;"
>
<img src="https://pikwizard.com/pw/medium/97d10c8bae0a6b7151abf81196ffde41.jpg" style="margin: 0; width: 100%;" alt="" />
<p style="font-size: 12px; margin: 0;">PikWizard</p>
</a>
</span>
</span>
Free (free of charge)
Free for personal and commercial use.
Author: Awesome Content
Similar Free Stock Images

Premium


Premium

Premium


Premium


Premium


Premium


Premium


Premium


Premium


Premium


Premium

Premium


Premium

Premium


Premium


Premium


Premium

Premium


Premium


Premium


Premium


Premium


Premium


Premium


Premium

Explore More Free Stock Images