- Home >
- Stock Photos >
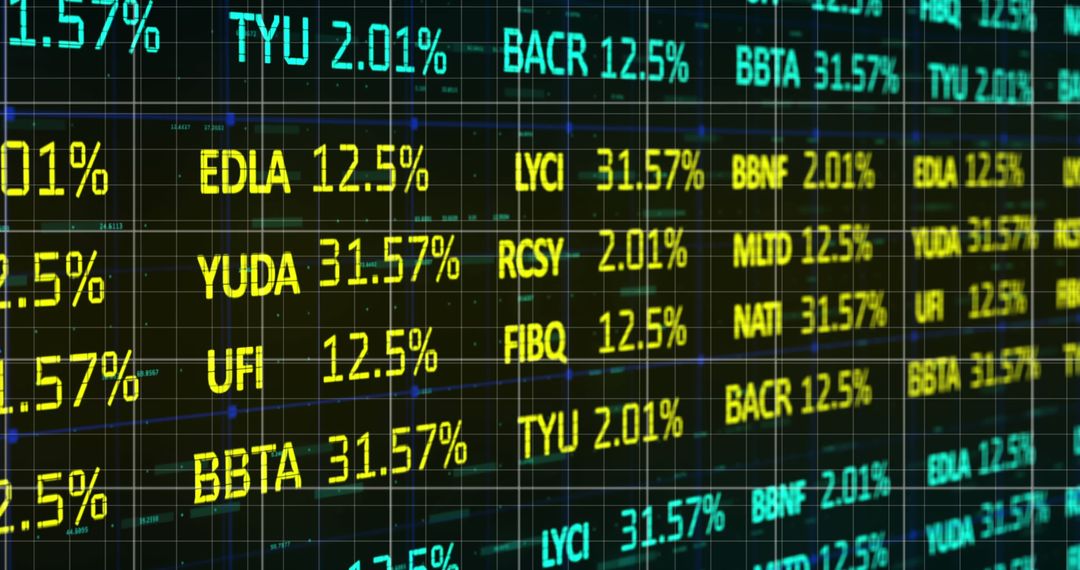
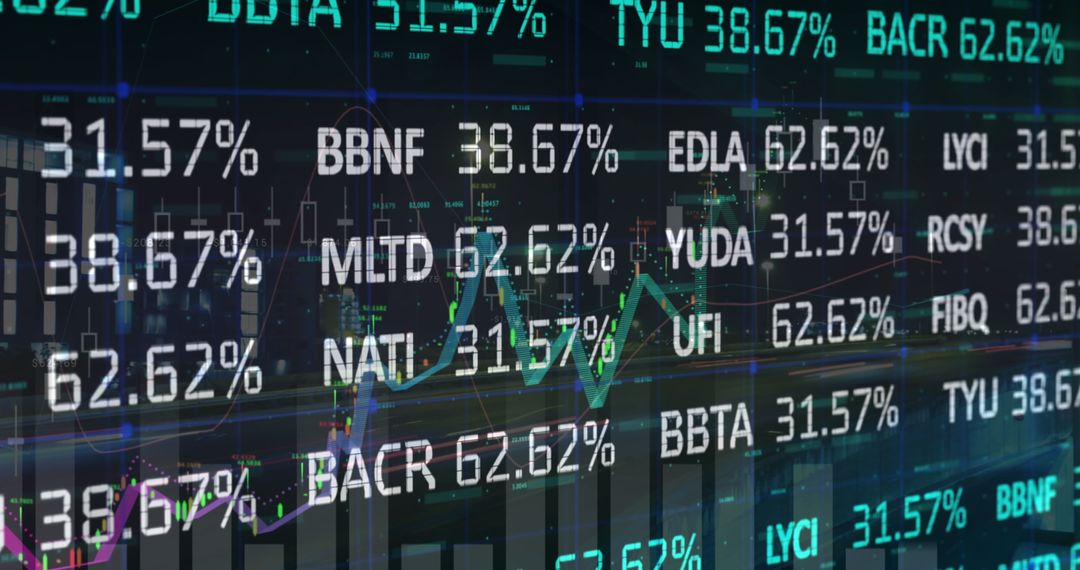
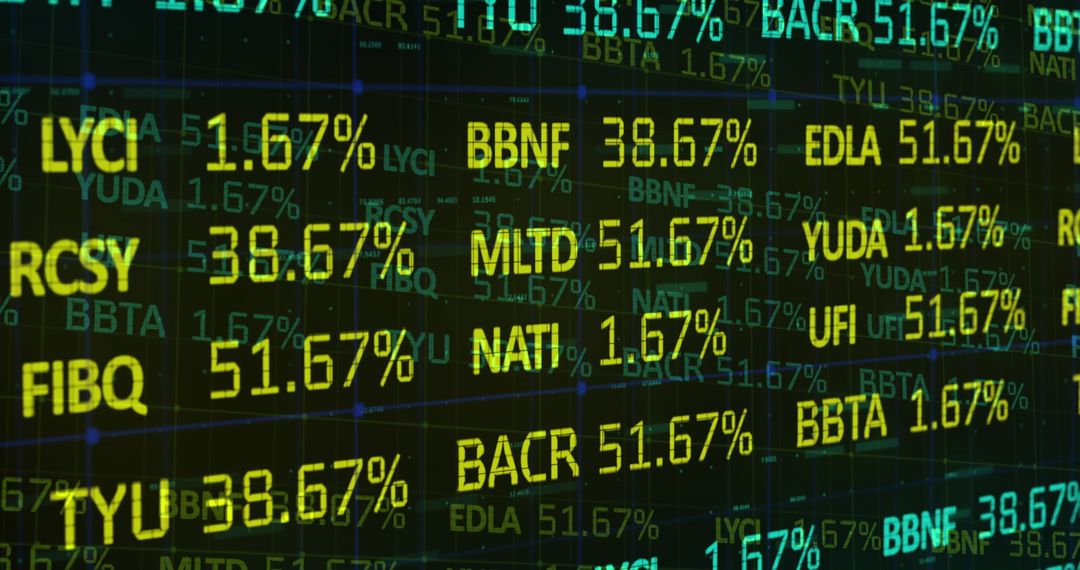
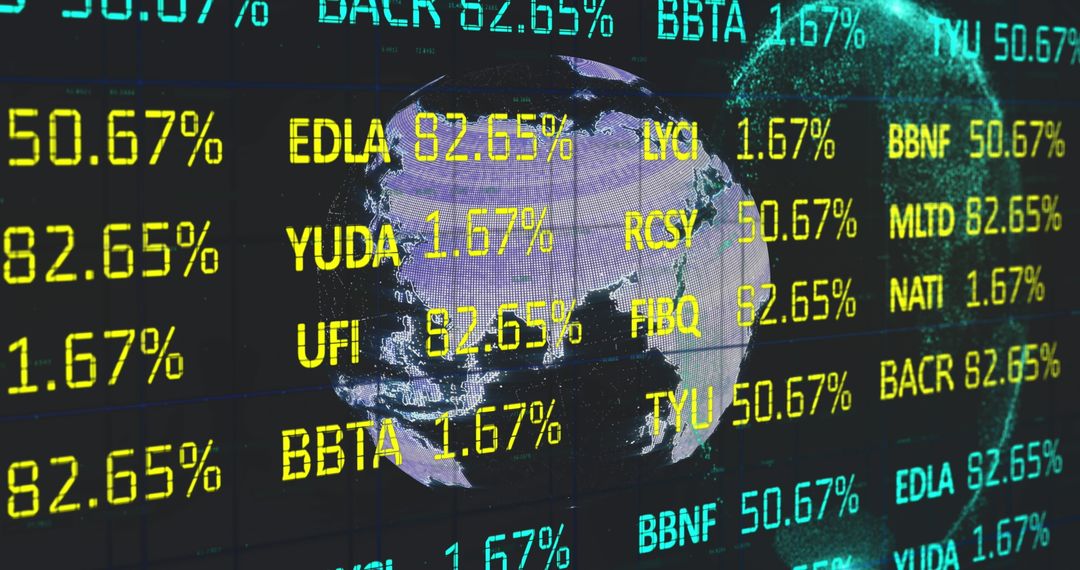
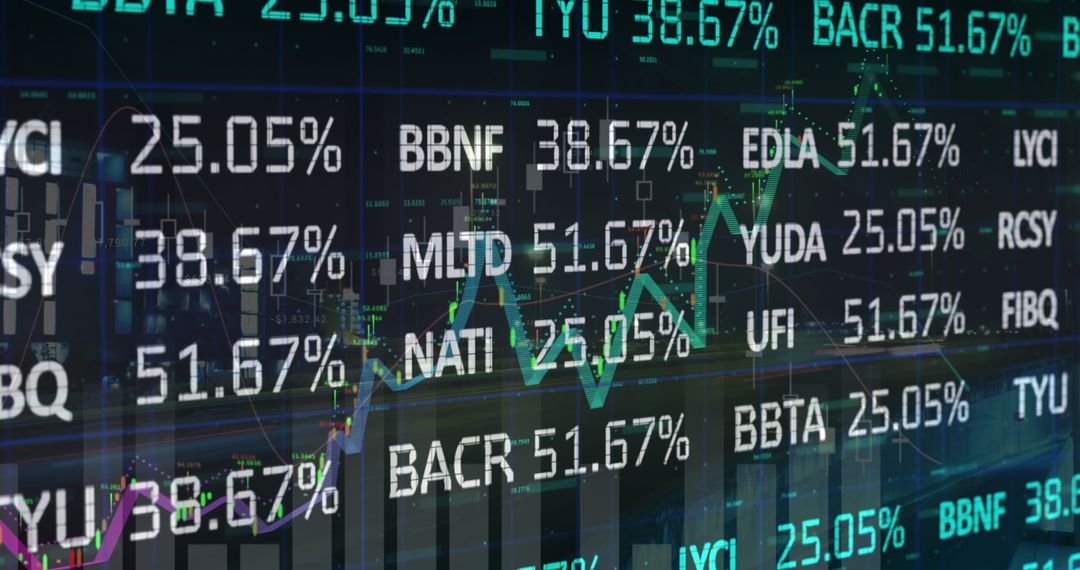
- Dynamic Stock Market Data Visualization with Futuristic Overlay
Dynamic Stock Market Data Visualization with Futuristic Overlay Image

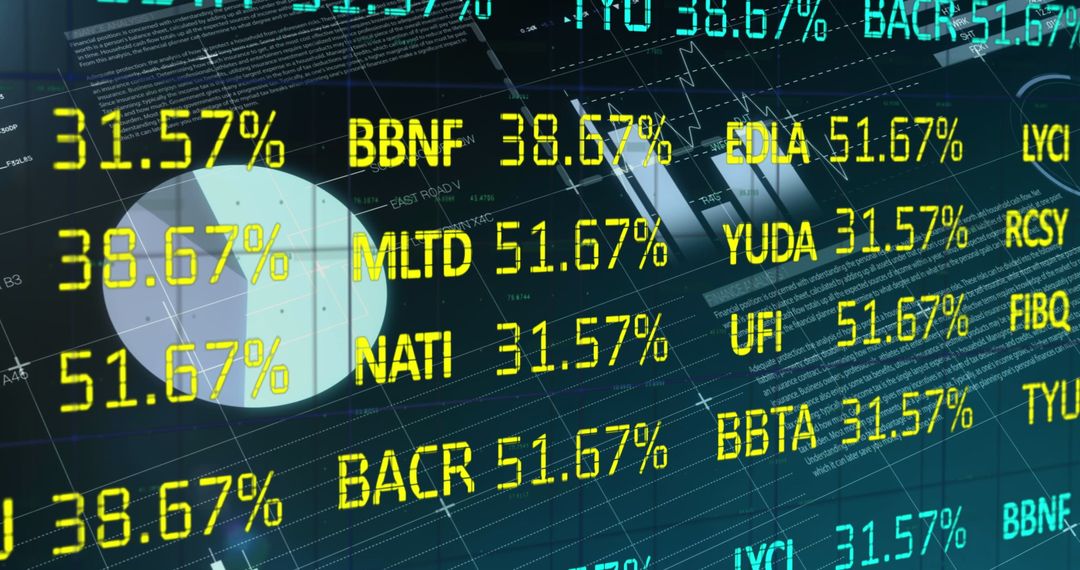
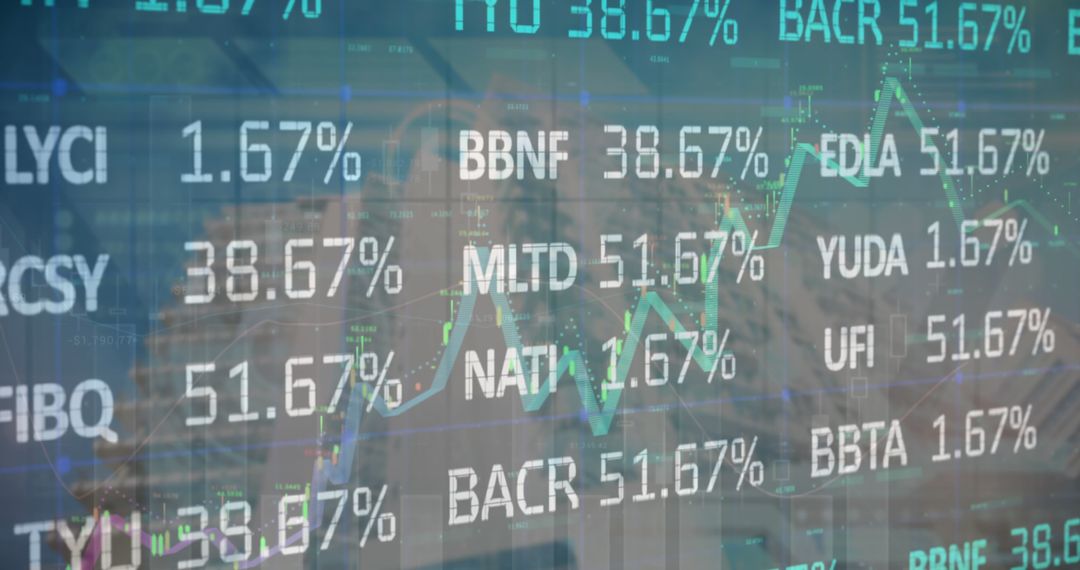
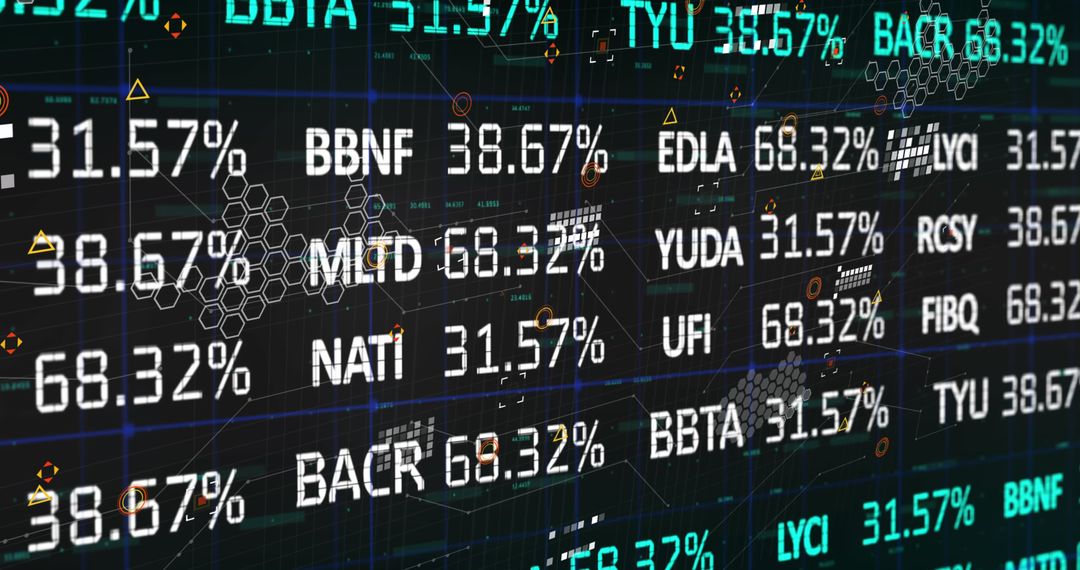
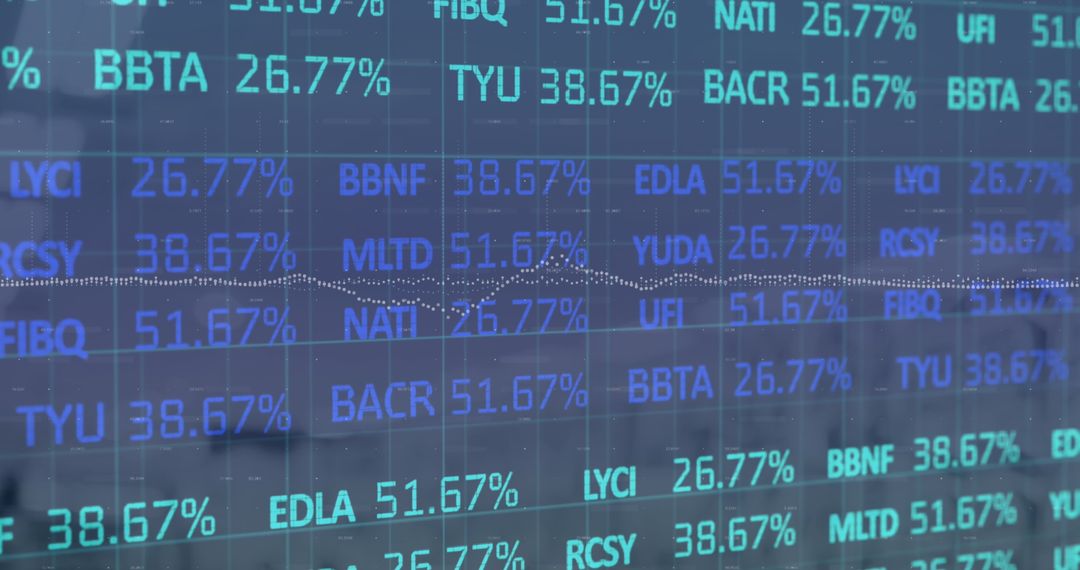
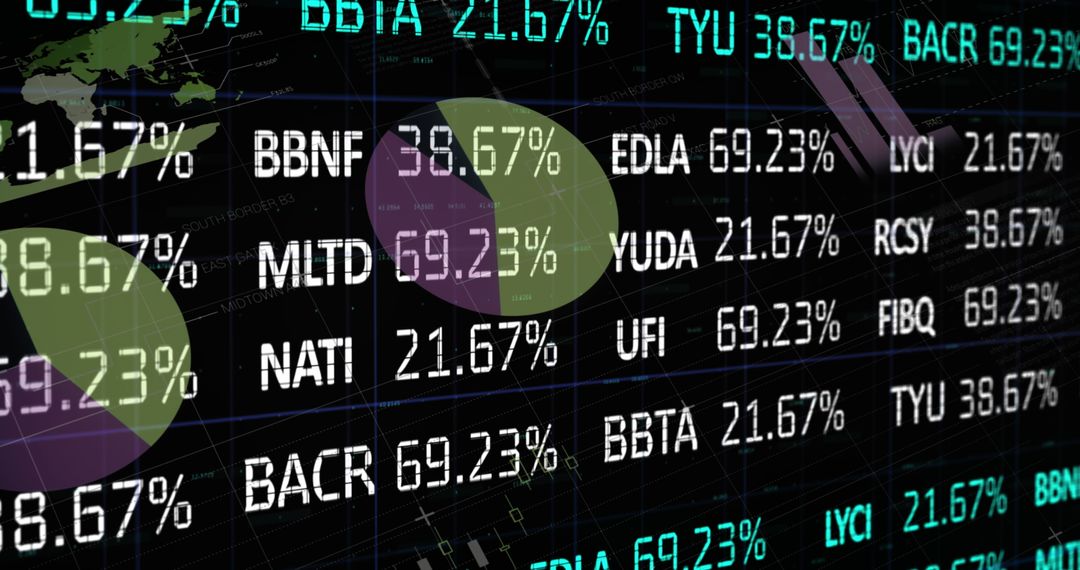
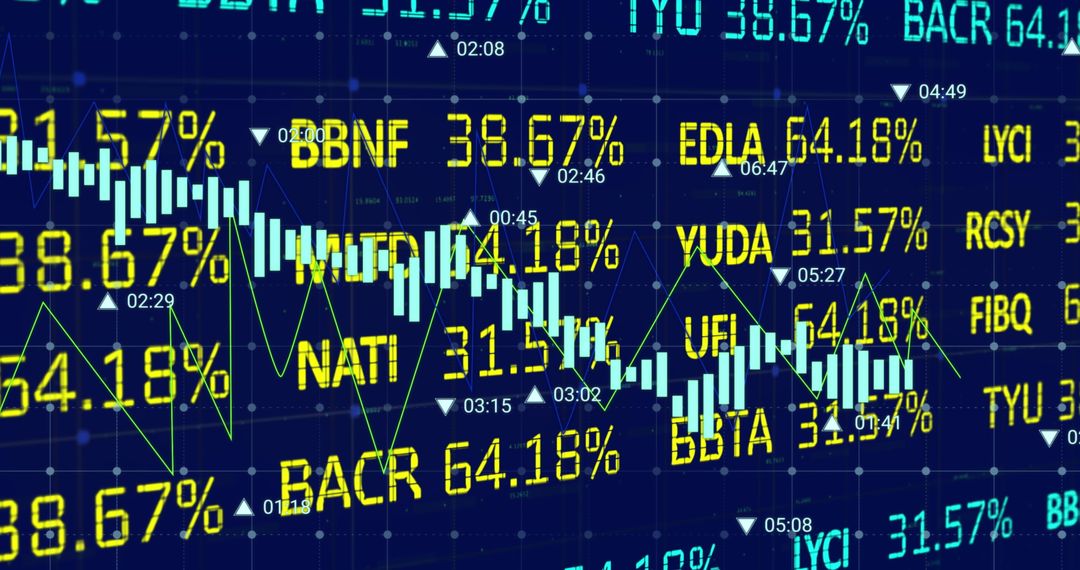
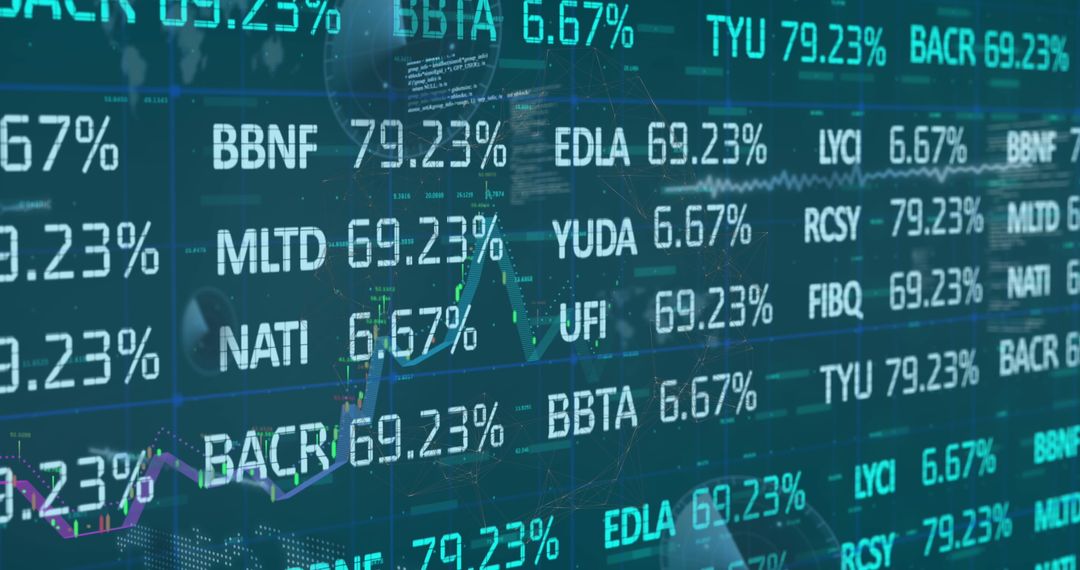
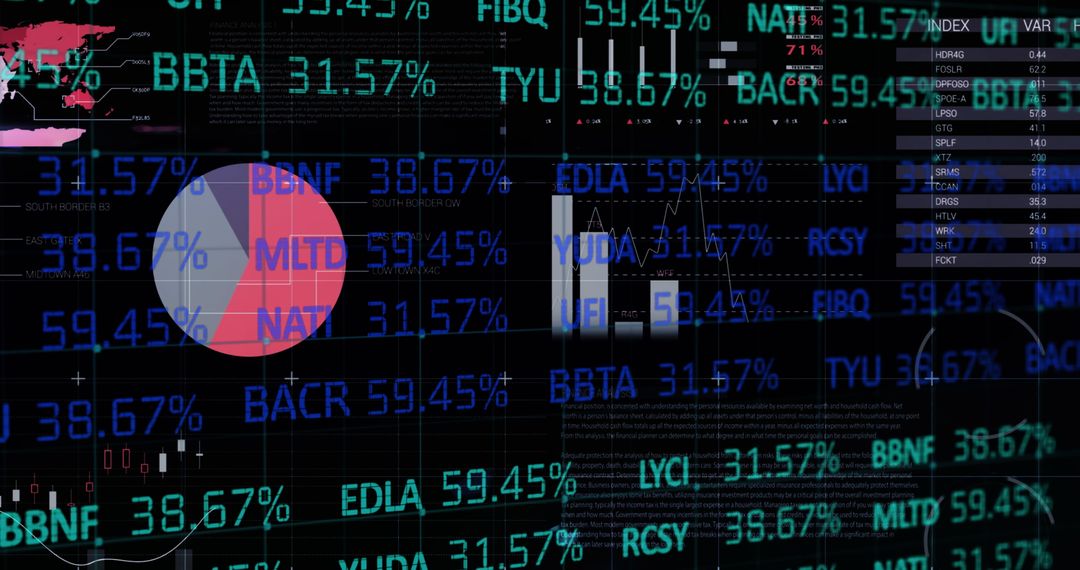
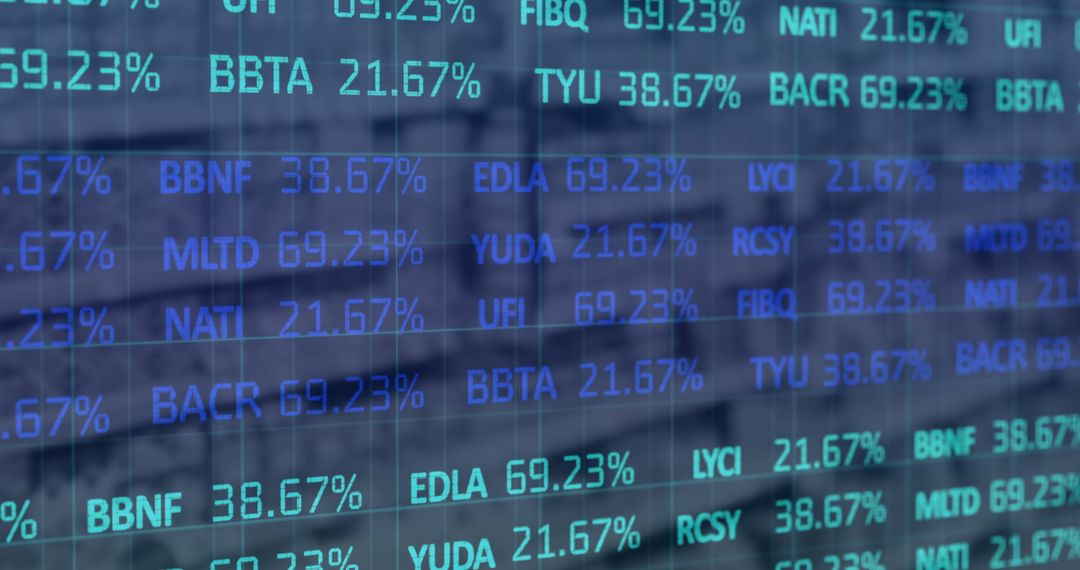
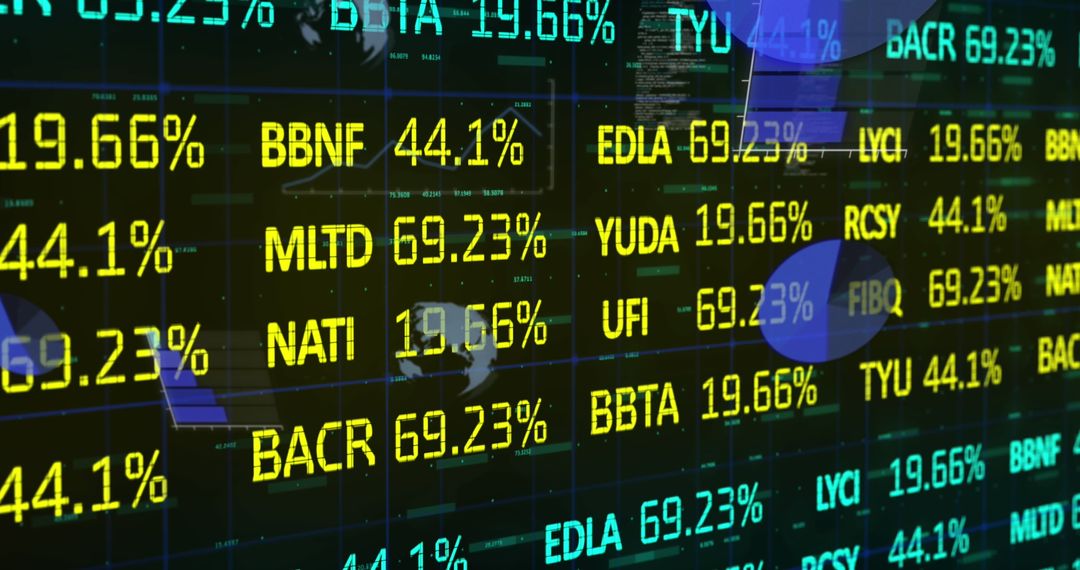
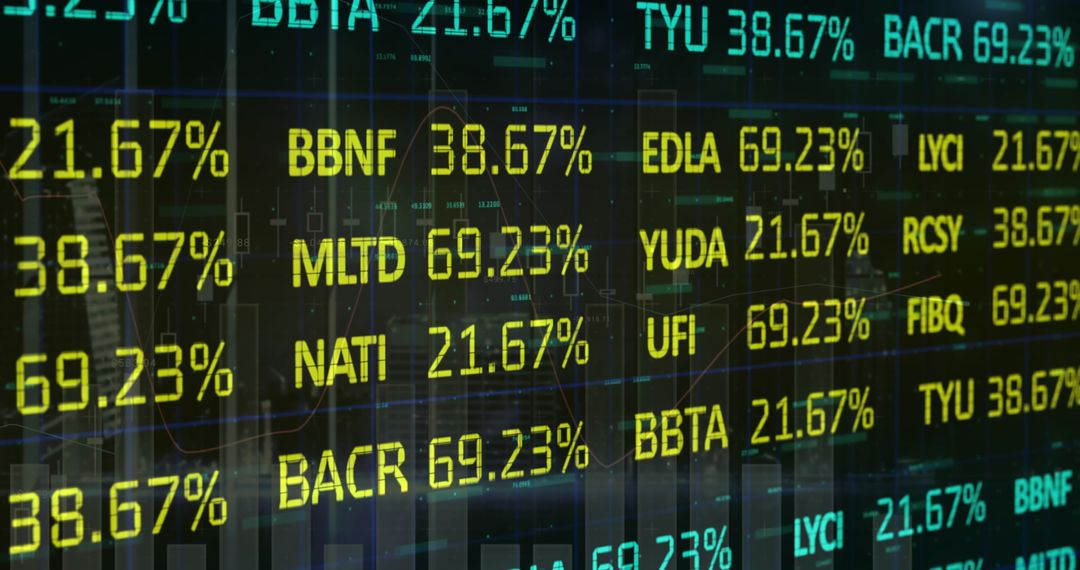
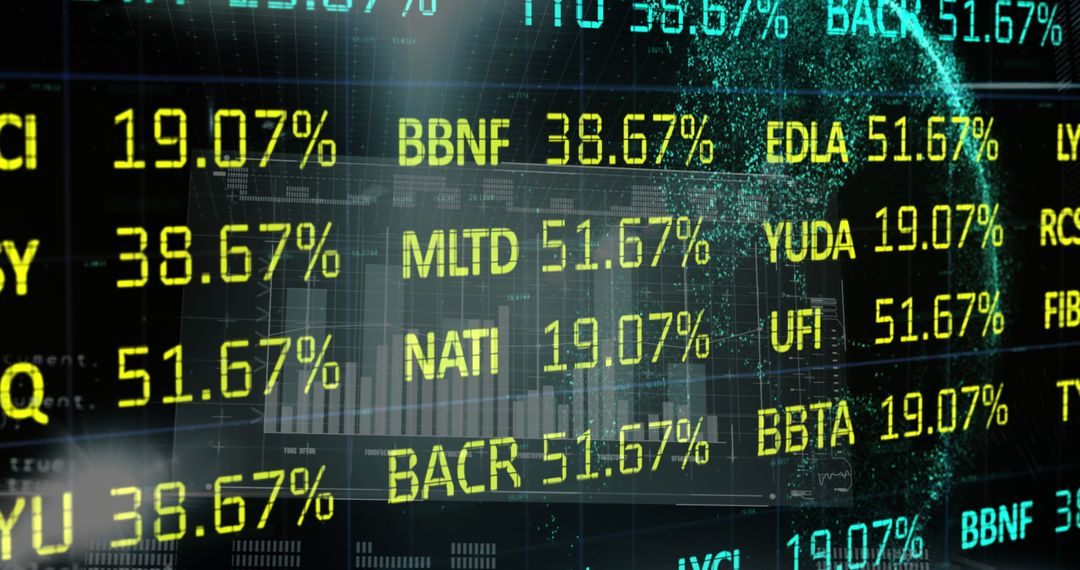
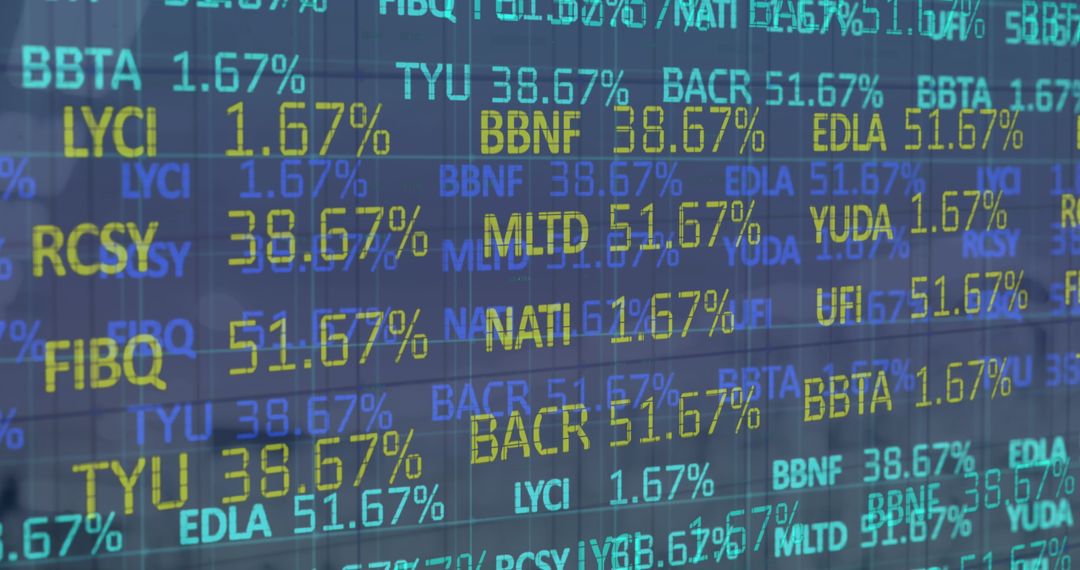
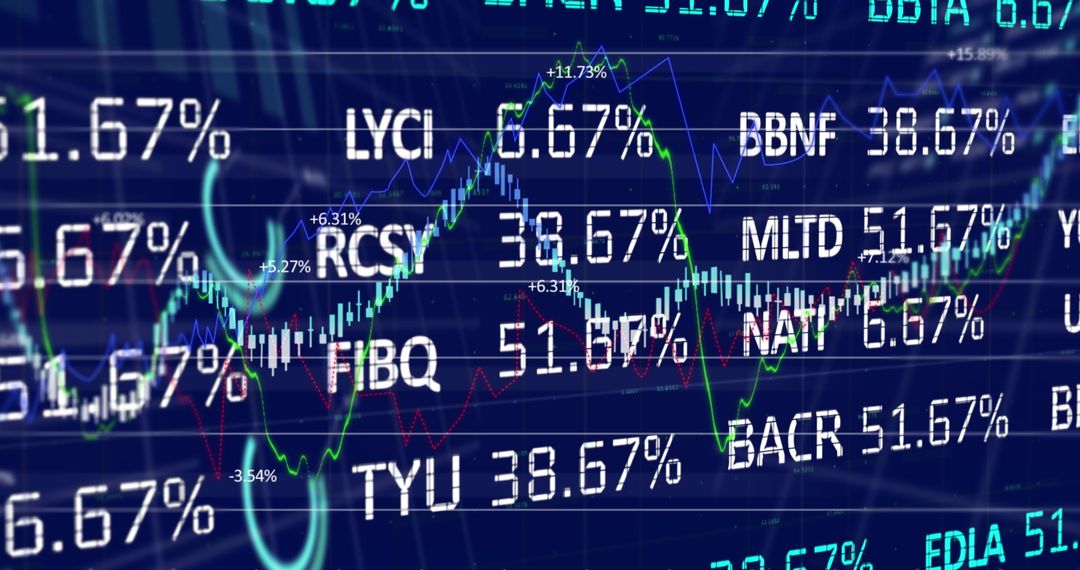
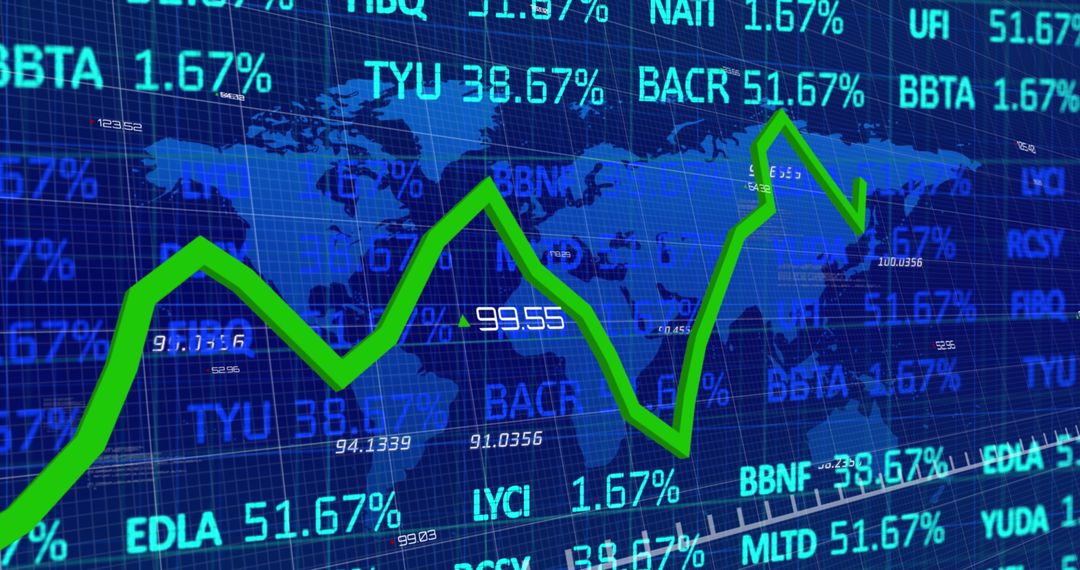
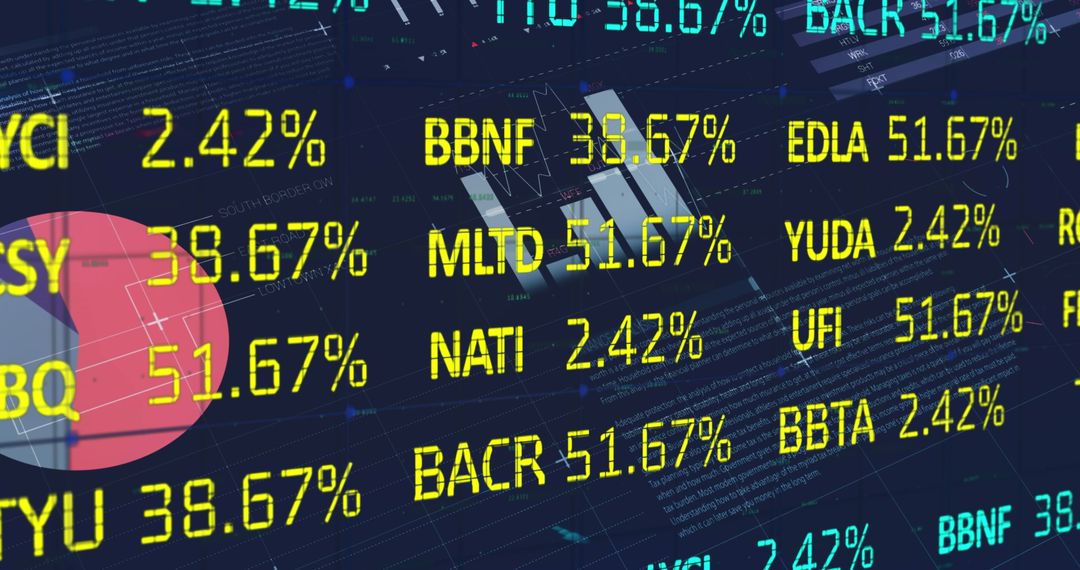
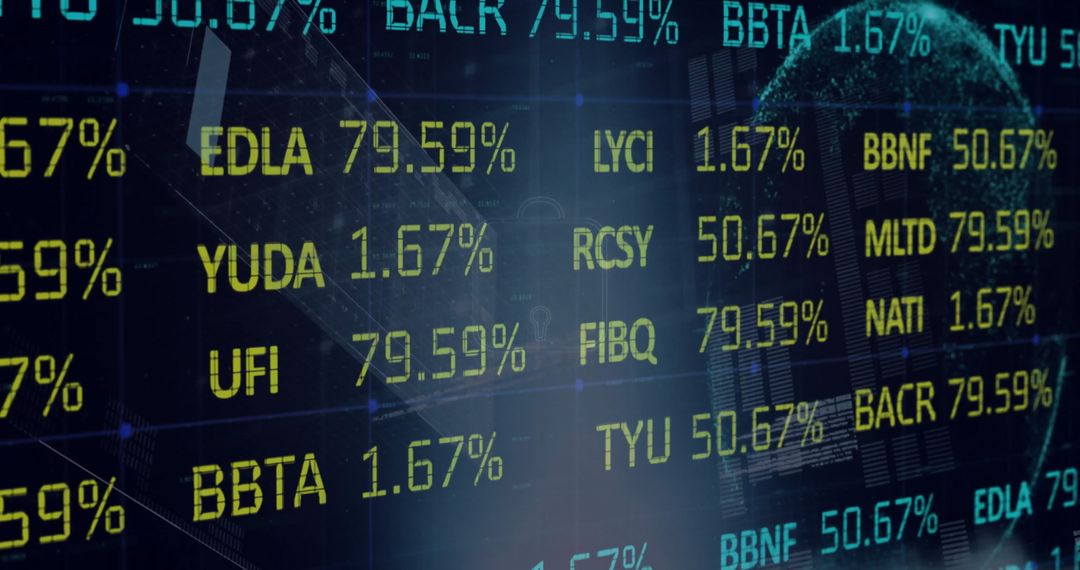
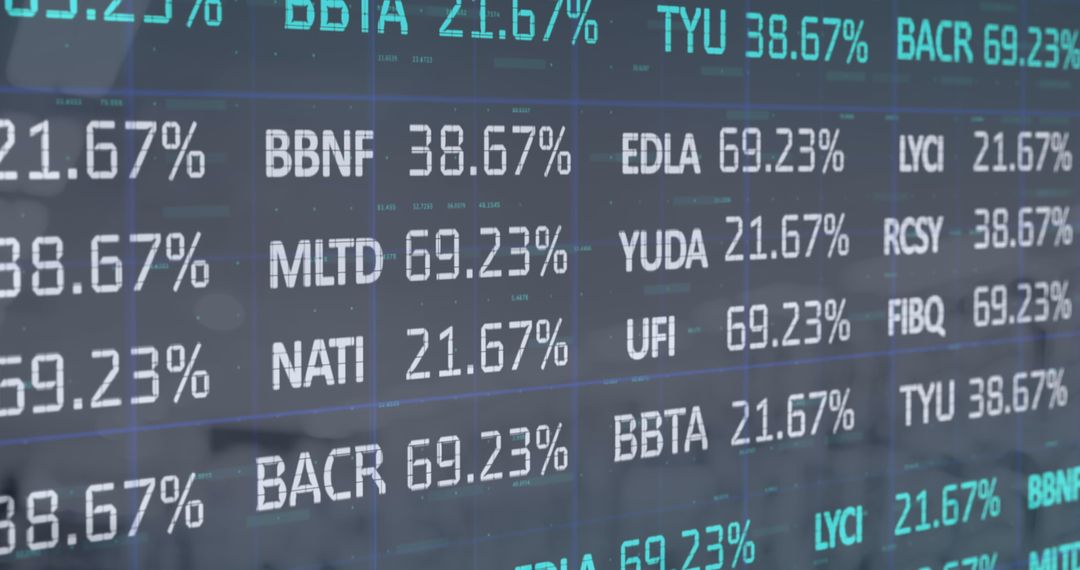
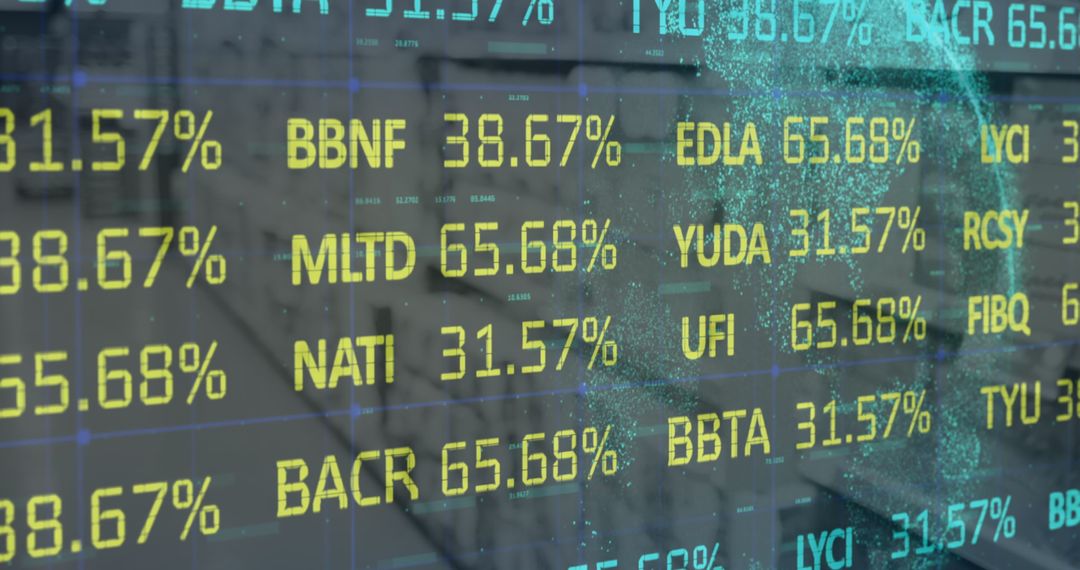
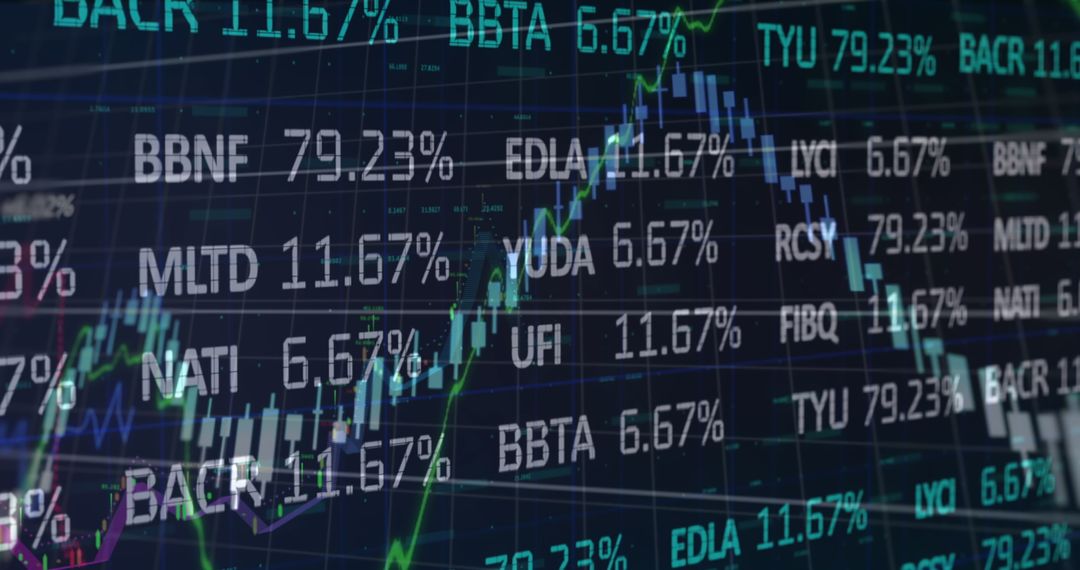
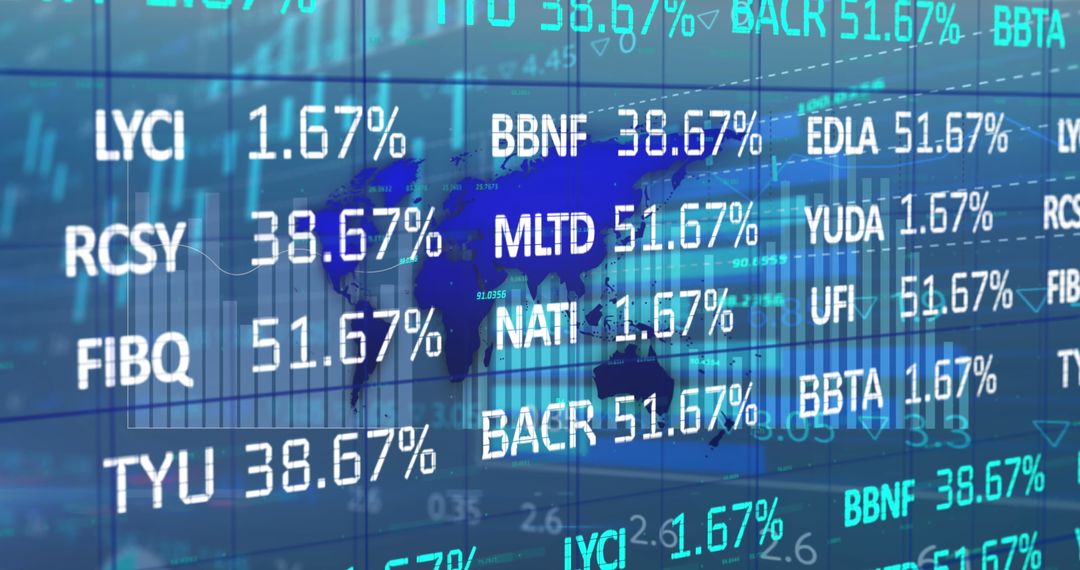
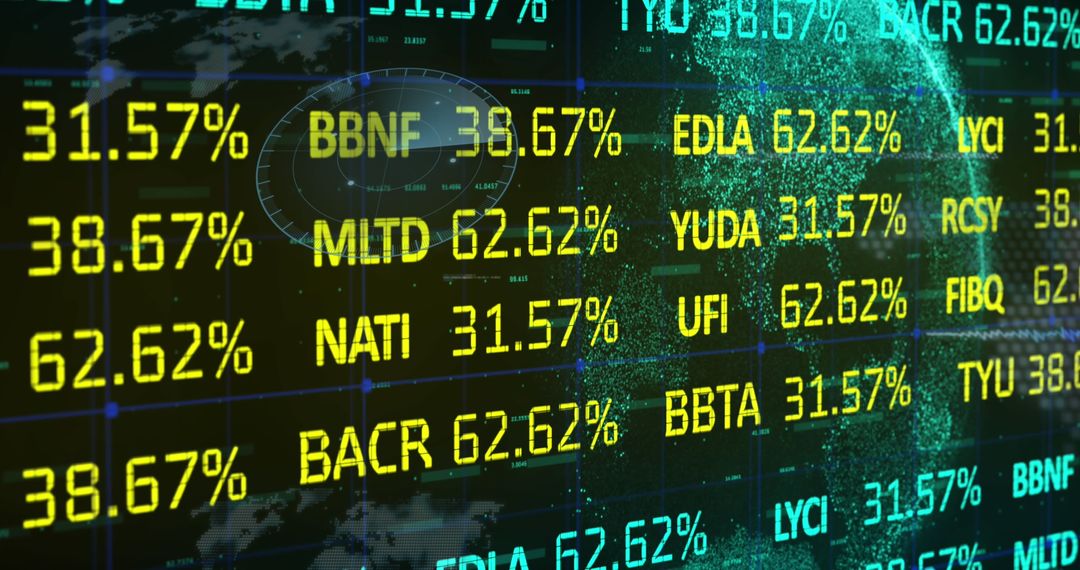
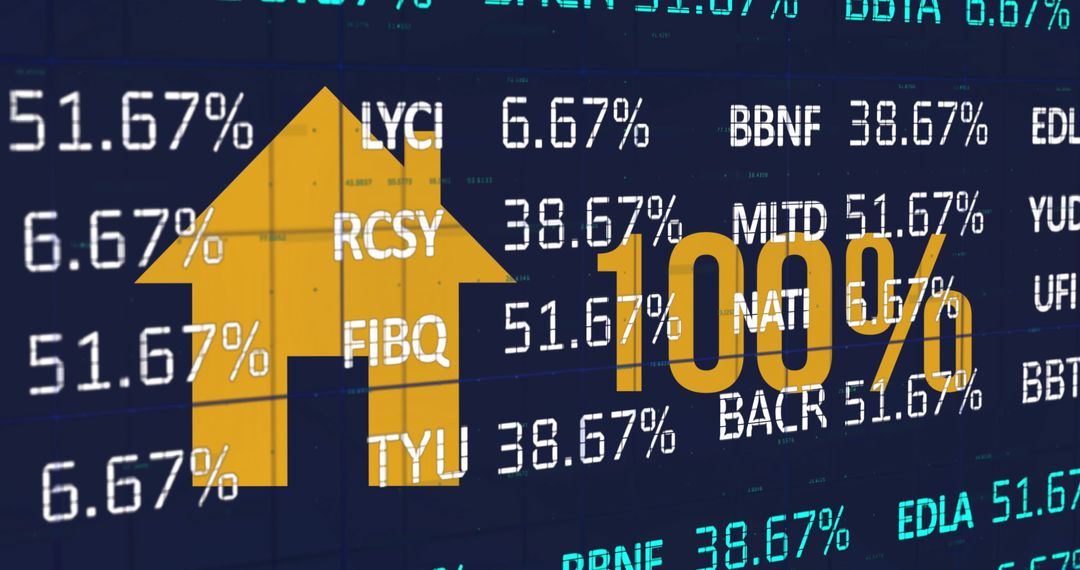
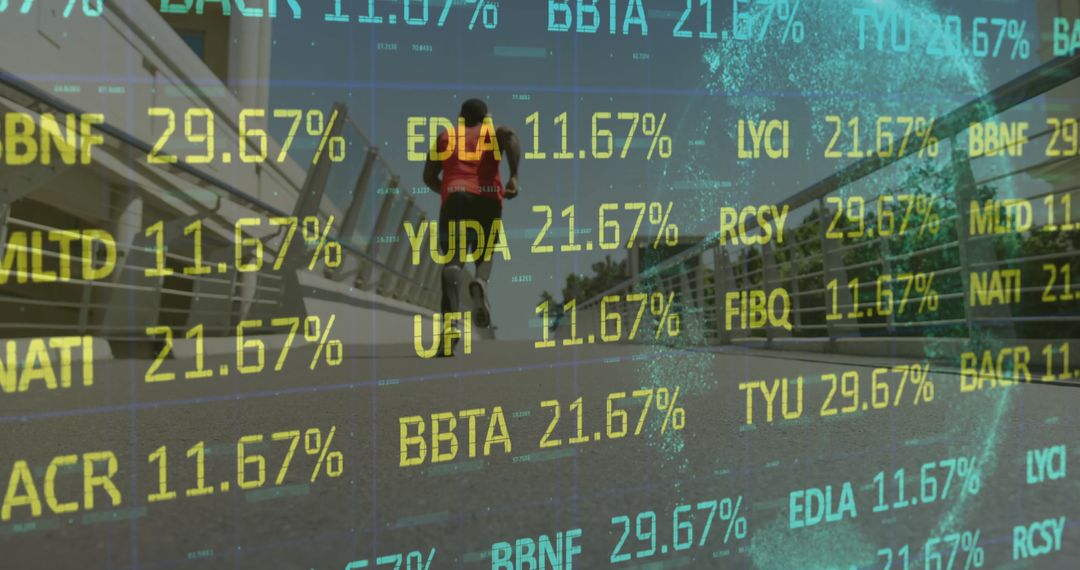
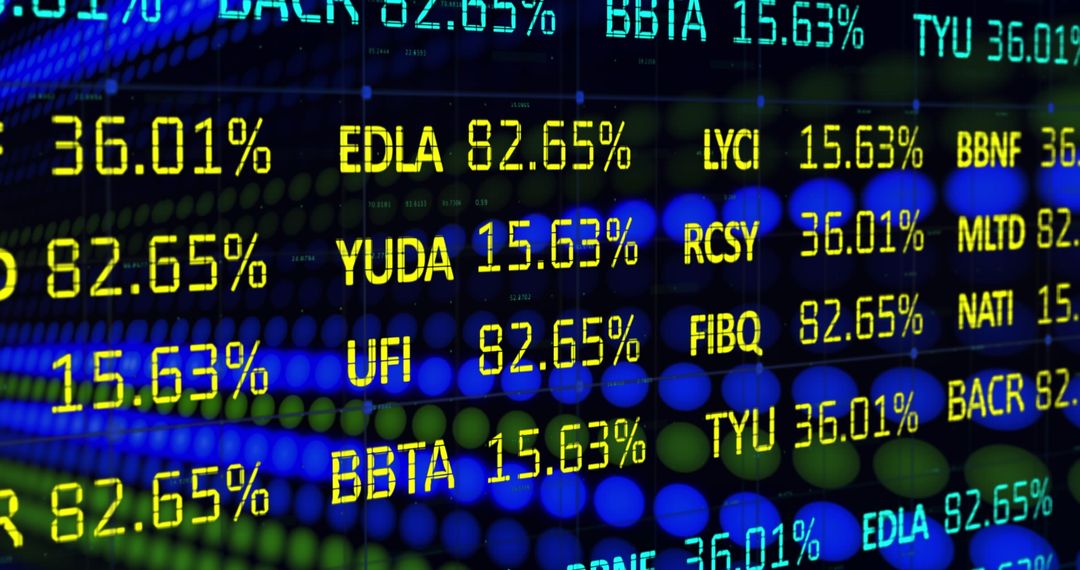
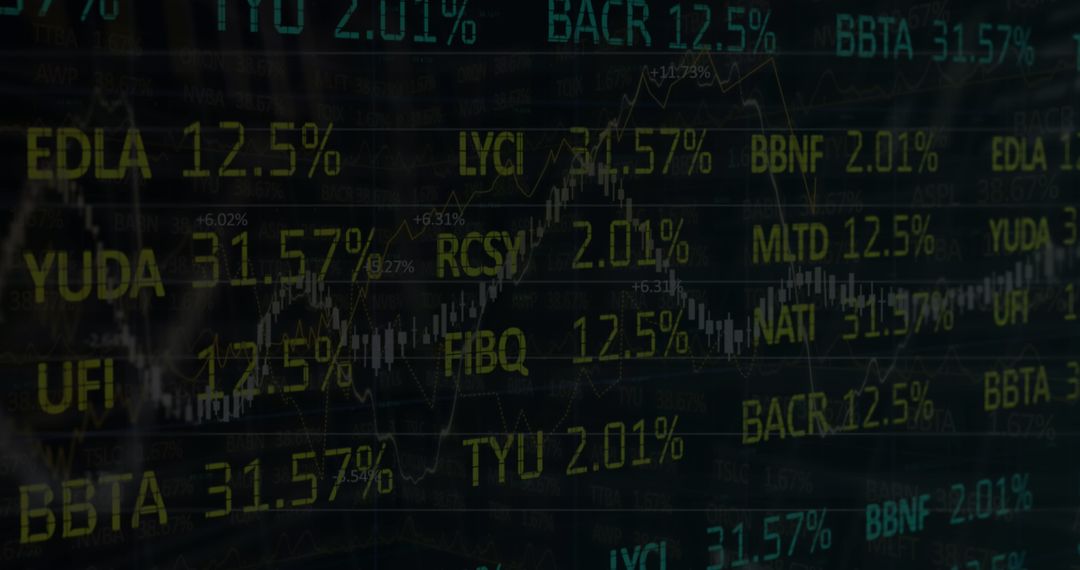
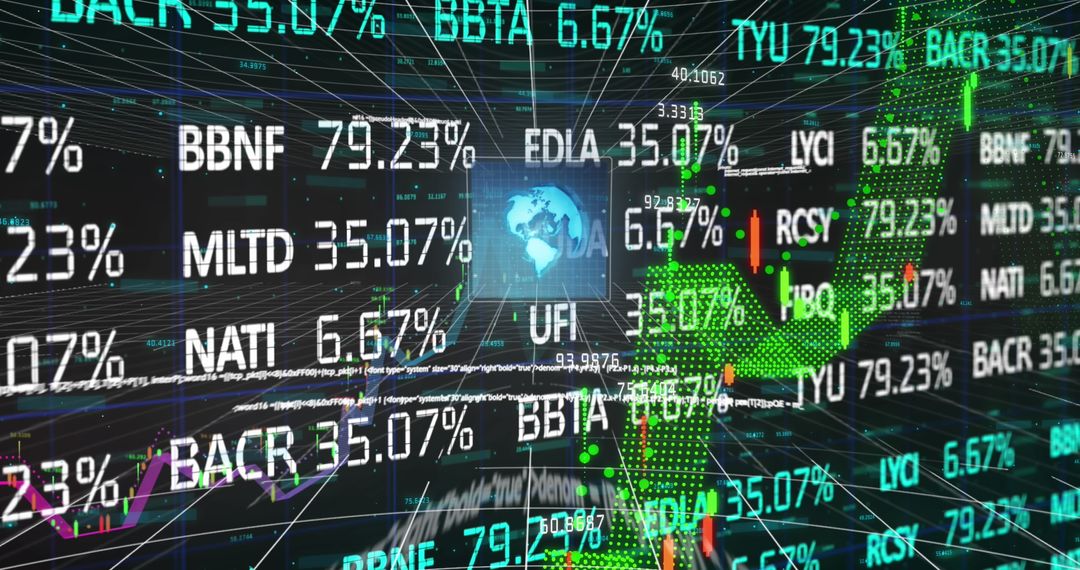
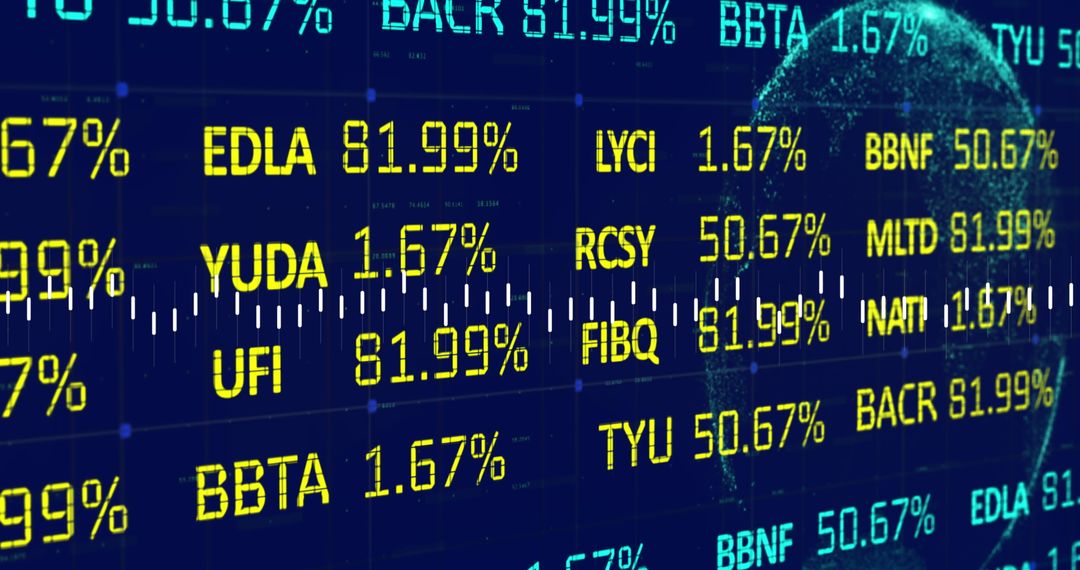
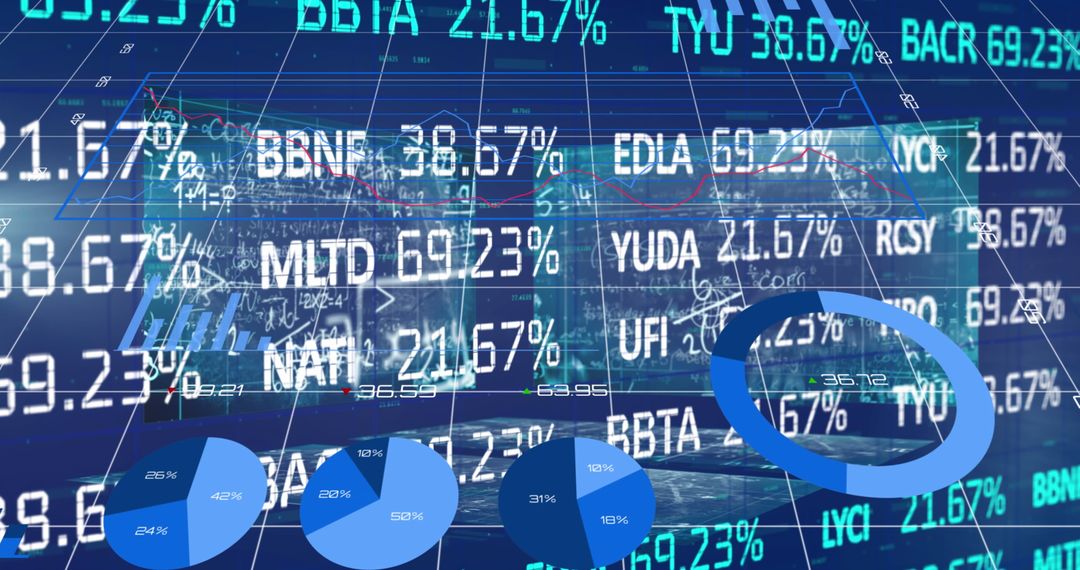
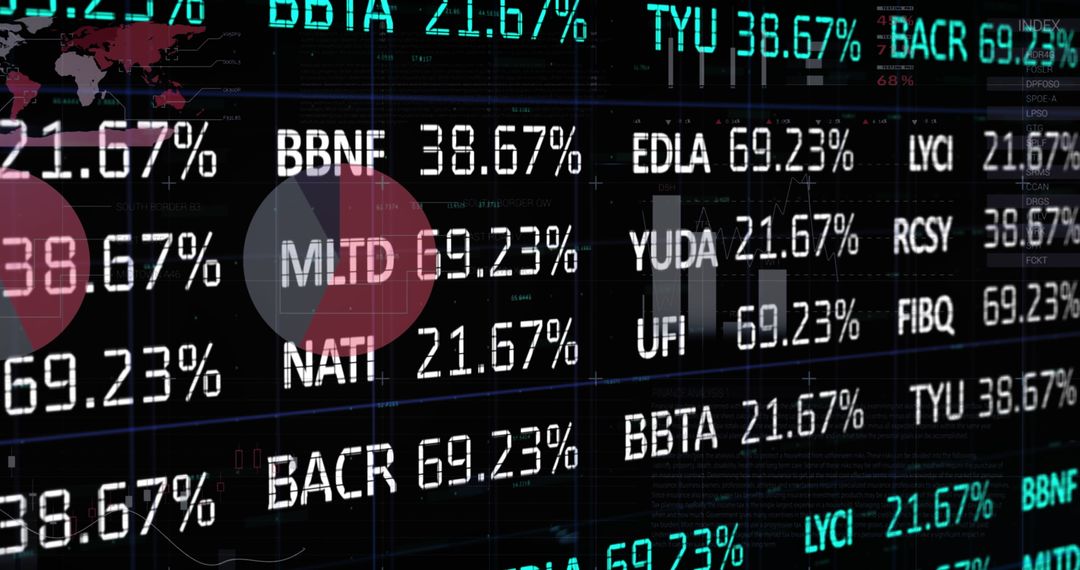
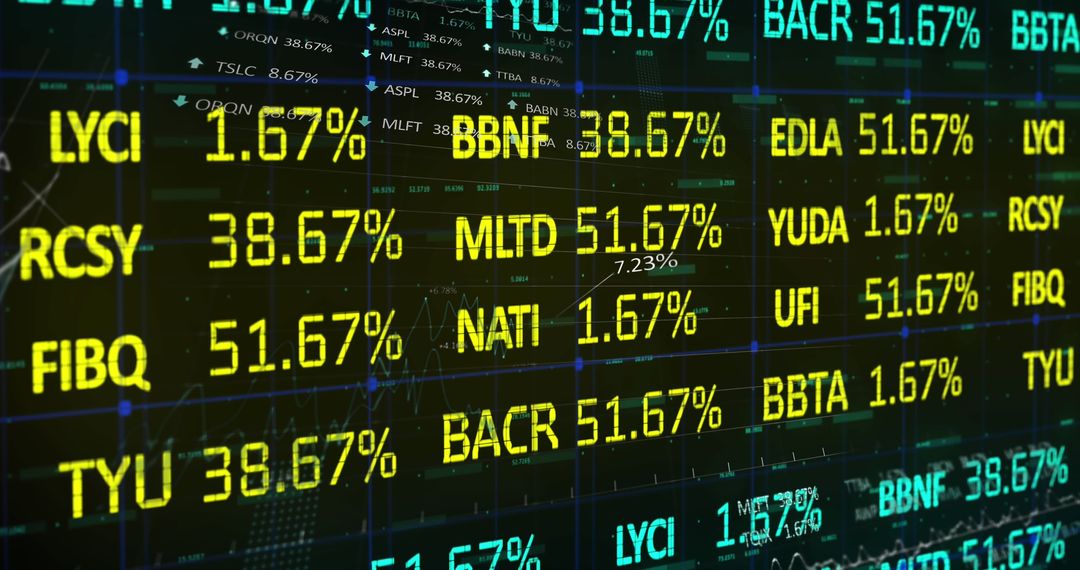
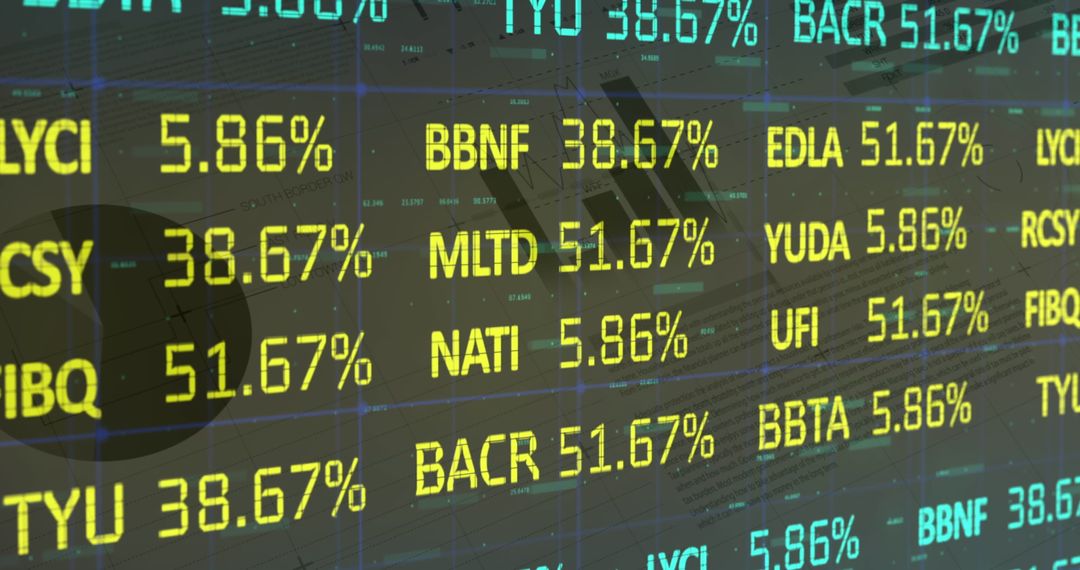
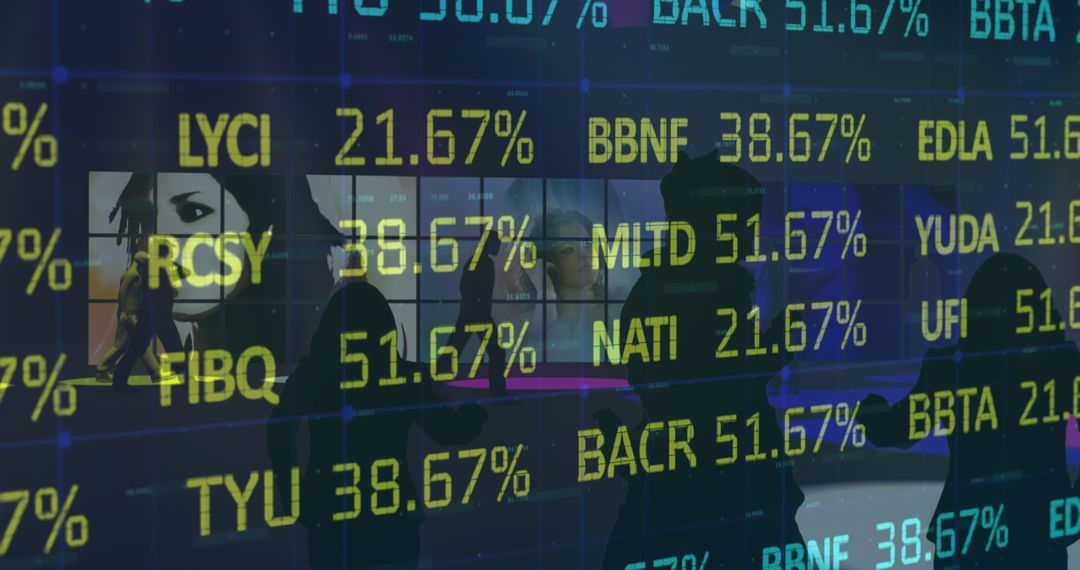
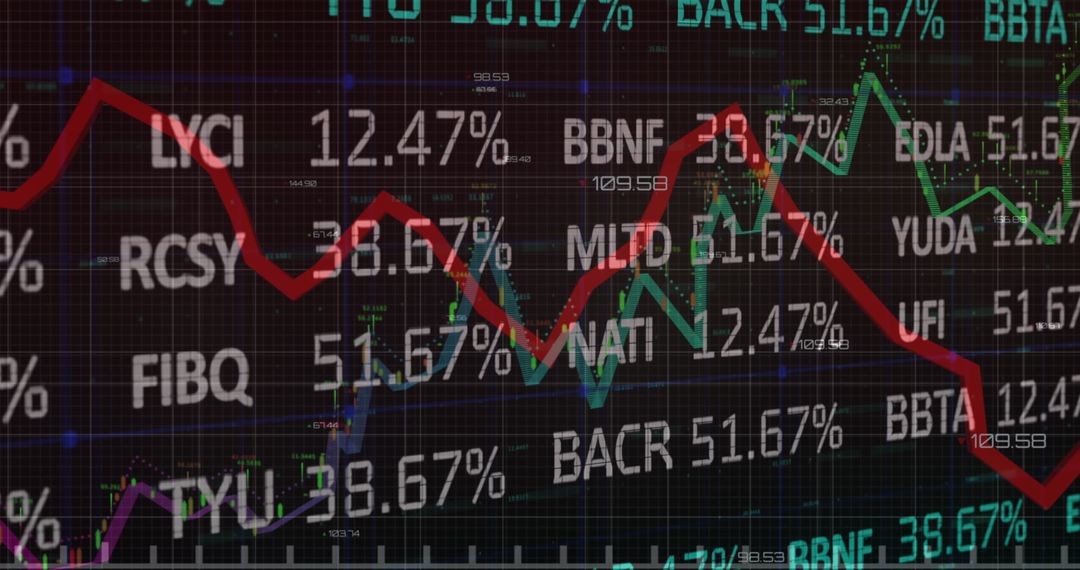
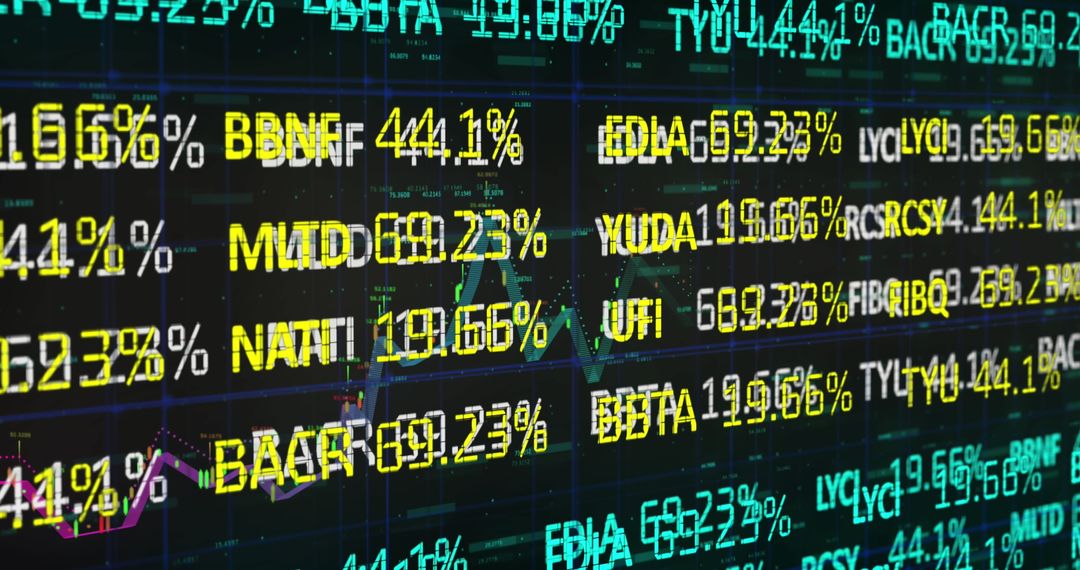
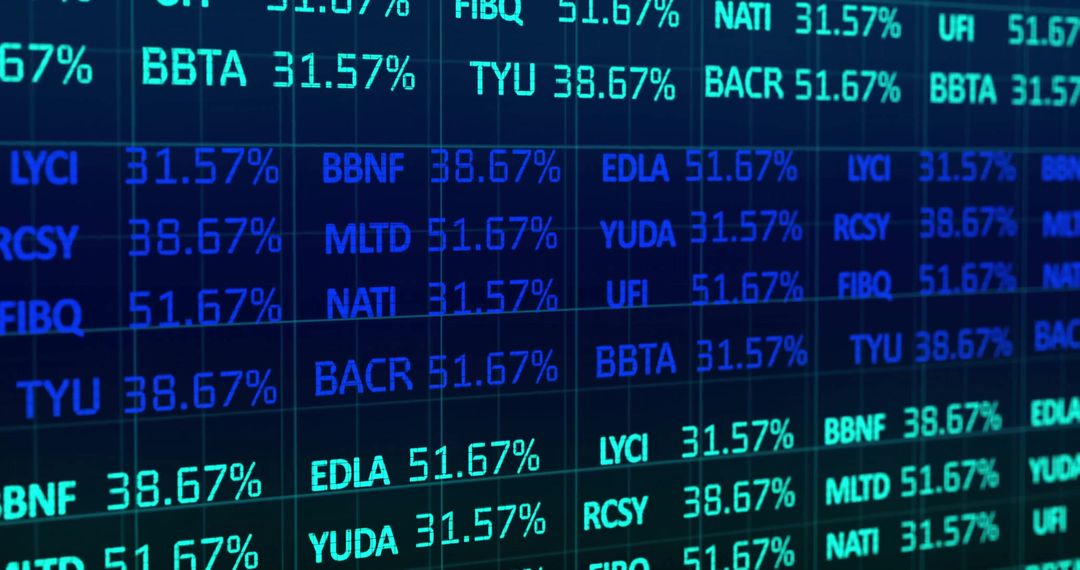
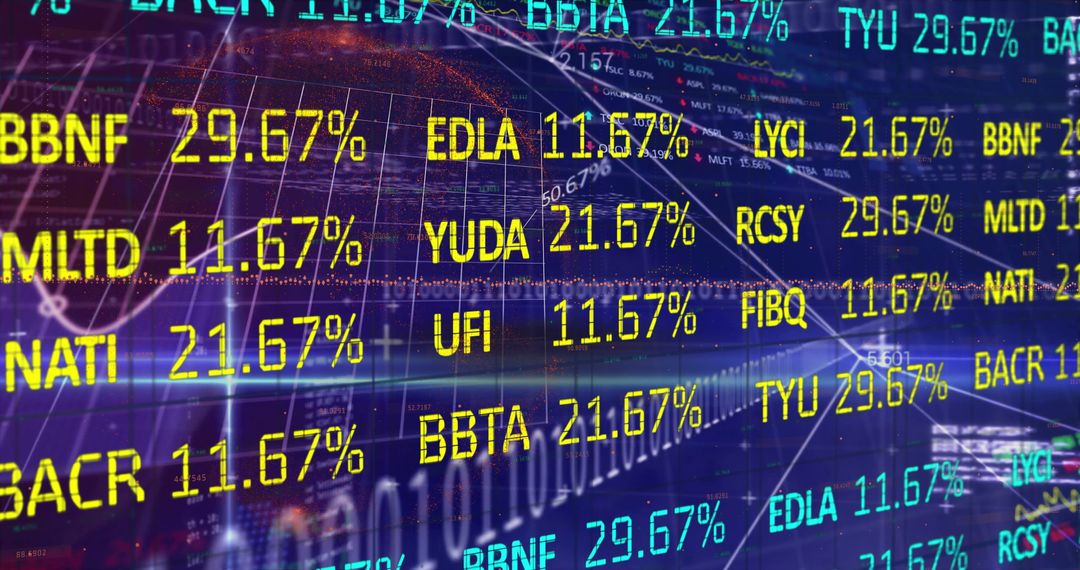
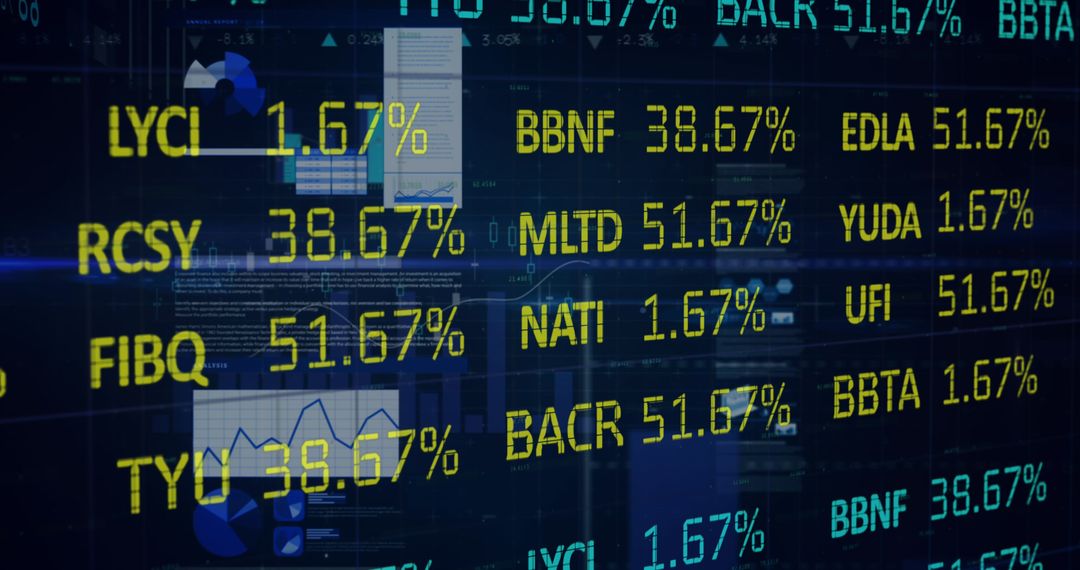
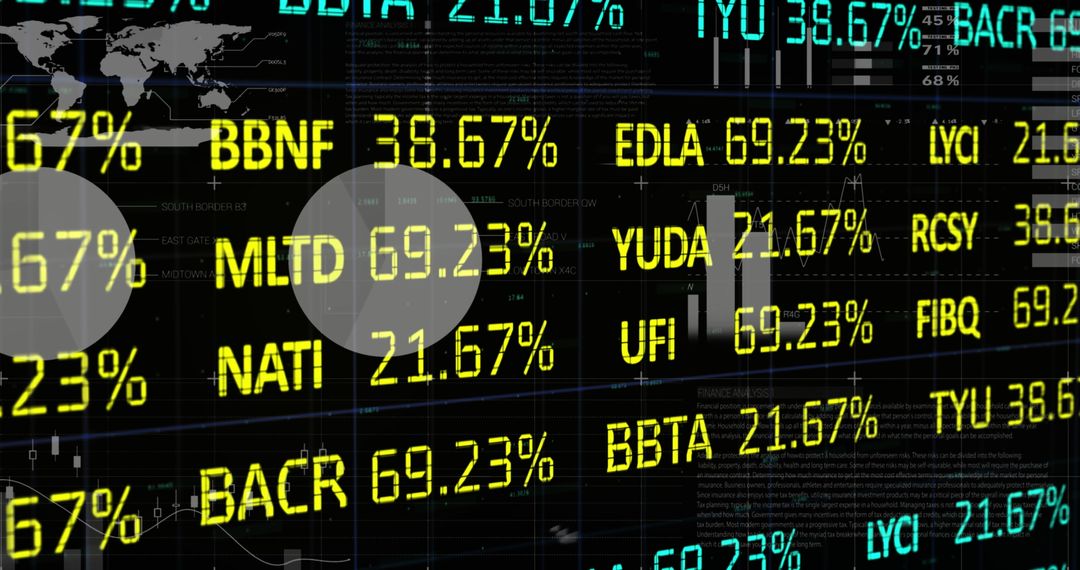
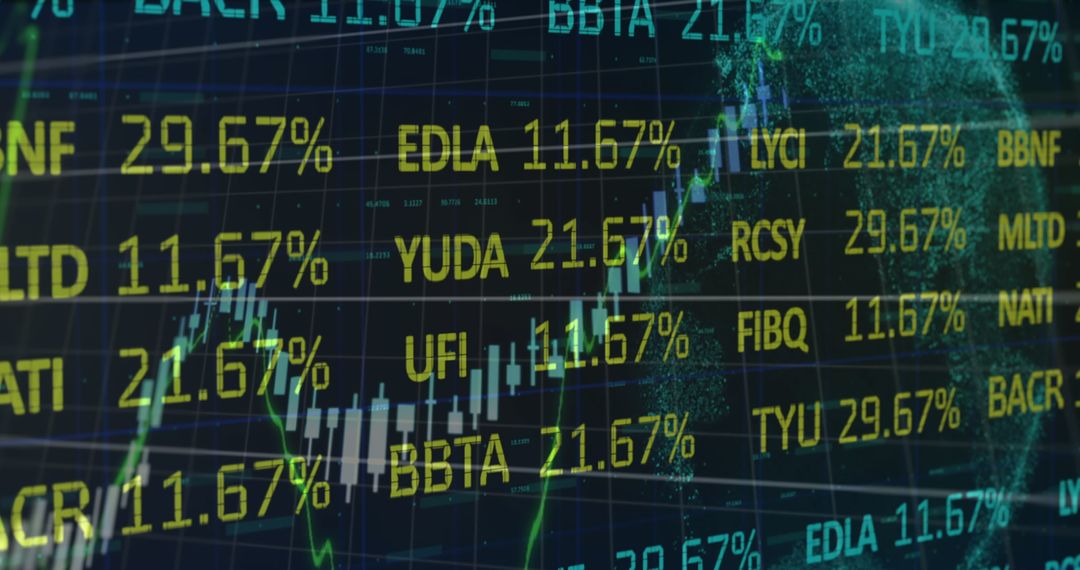
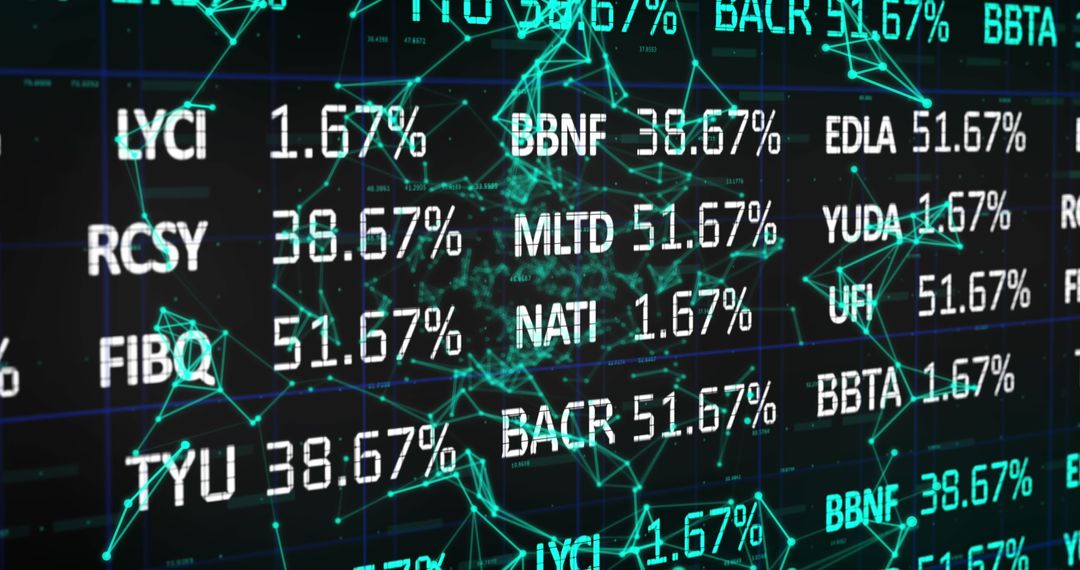
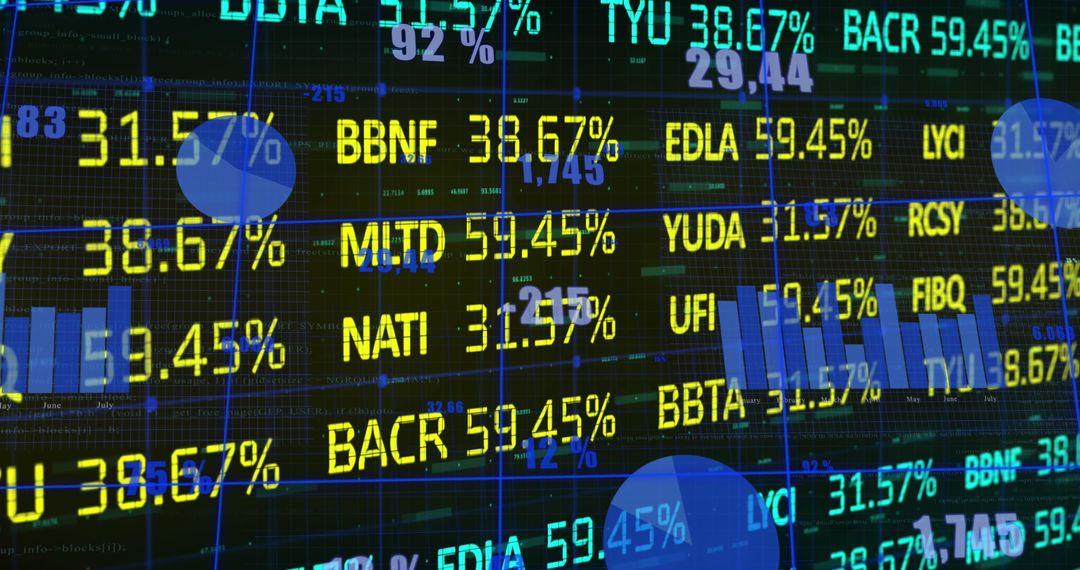
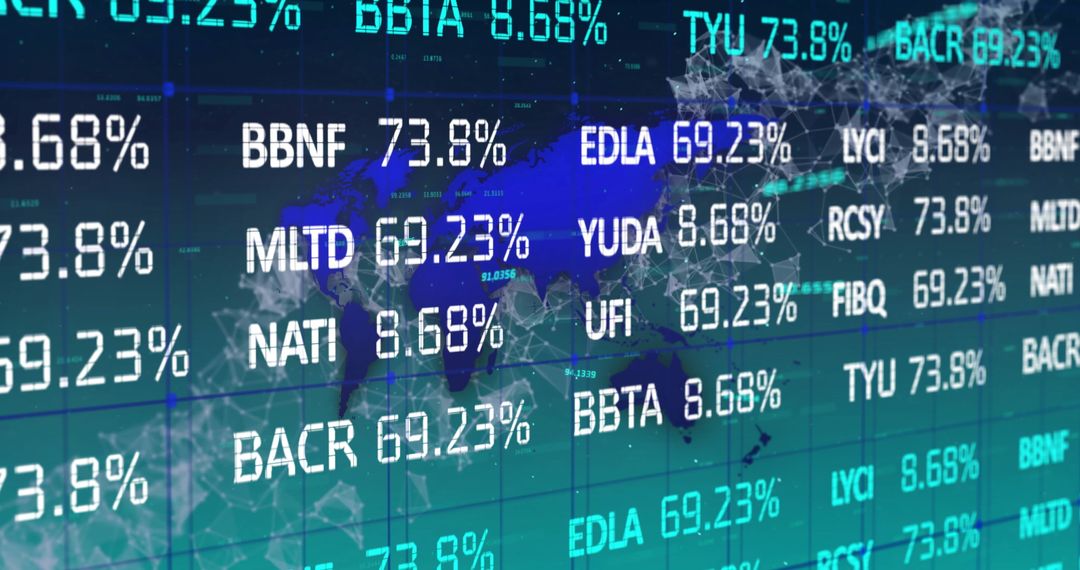
Enhance presentations or reports on financial trends and stock market dynamics with this visual. It depicts real-time data appearing dynamically across a digital dashboard, bringing a modern technological edge to topics related to investment strategies, financial forecasting, or market analysis. Brochures, websites, and digital seminars can also use this visual for emphasizing cutting-edge financial solutions.
Powered by 


2
downloads
downloads
Tags:
More
Credit Photo
If you would like to credit the Photo, here are some ways you can do so
Text Link
photo Link
<span class="text-link">
<span>
<a target="_blank" href=https://pikwizard.com/photo/dynamic-stock-market-data-visualization-with-futuristic-overlay/a85ea8f9e35dfe93a4abee429ef7b08e/>PikWizard</a>
</span>
</span>
<span class="image-link">
<span
style="margin: 0 0 20px 0; display: inline-block; vertical-align: middle; width: 100%;"
>
<a
target="_blank"
href="https://pikwizard.com/photo/dynamic-stock-market-data-visualization-with-futuristic-overlay/a85ea8f9e35dfe93a4abee429ef7b08e/"
style="text-decoration: none; font-size: 10px; margin: 0;"
>
<img src="https://pikwizard.com/pw/medium/a85ea8f9e35dfe93a4abee429ef7b08e.jpg" style="margin: 0; width: 100%;" alt="" />
<p style="font-size: 12px; margin: 0;">PikWizard</p>
</a>
</span>
</span>
Free (free of charge)
Free for personal and commercial use.
Author: Awesome Content
Similar Free Stock Images
Premium


Premium


Premium


Premium

Premium


Premium


Premium


Premium


Premium


Premium


Premium


Premium


Premium

Premium


Premium


Premium


Premium


Premium


Premium


Premium


Premium


Premium


Premium


Premium