- Home >
- Stock Photos >
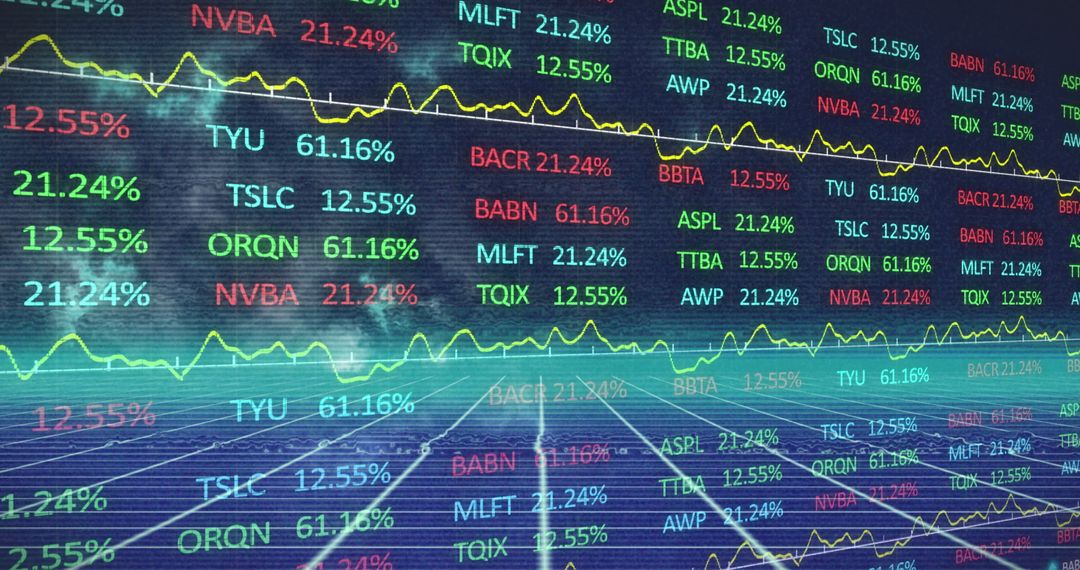
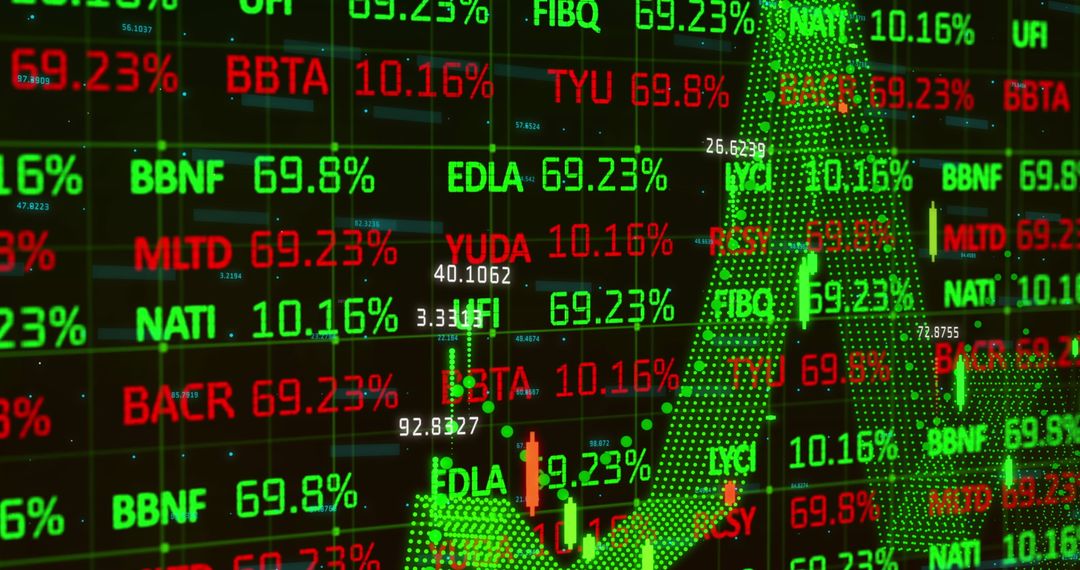
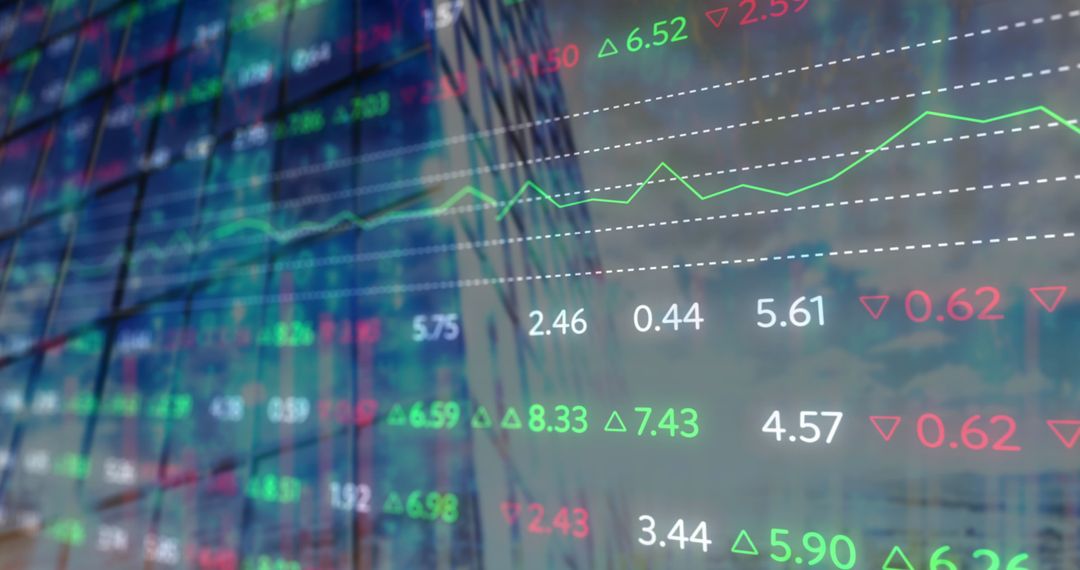
- Dynamic Stock Market Data Visualization with Global Financial Indicators
Dynamic Stock Market Data Visualization with Global Financial Indicators Image

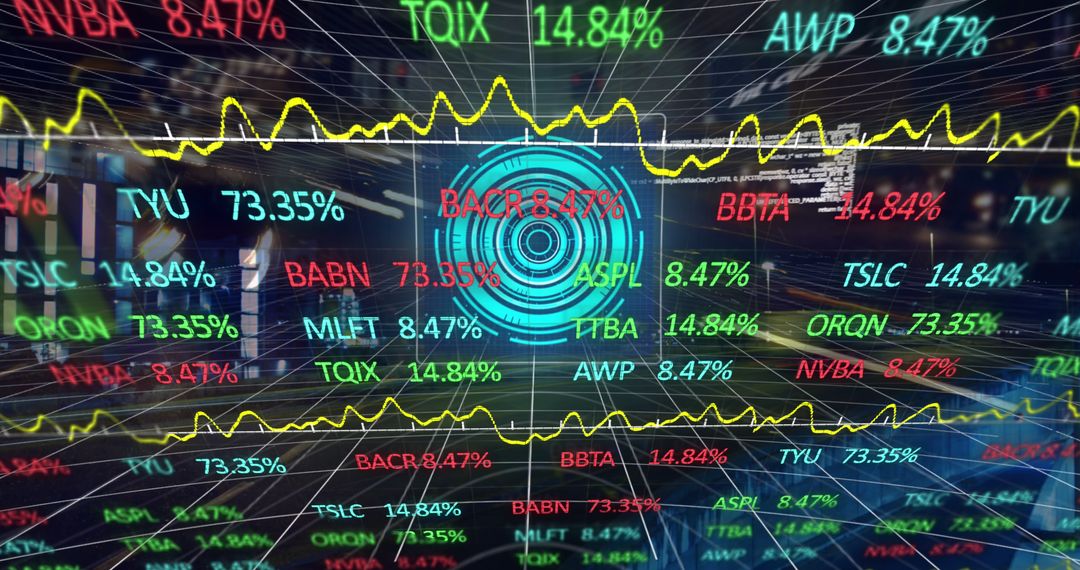
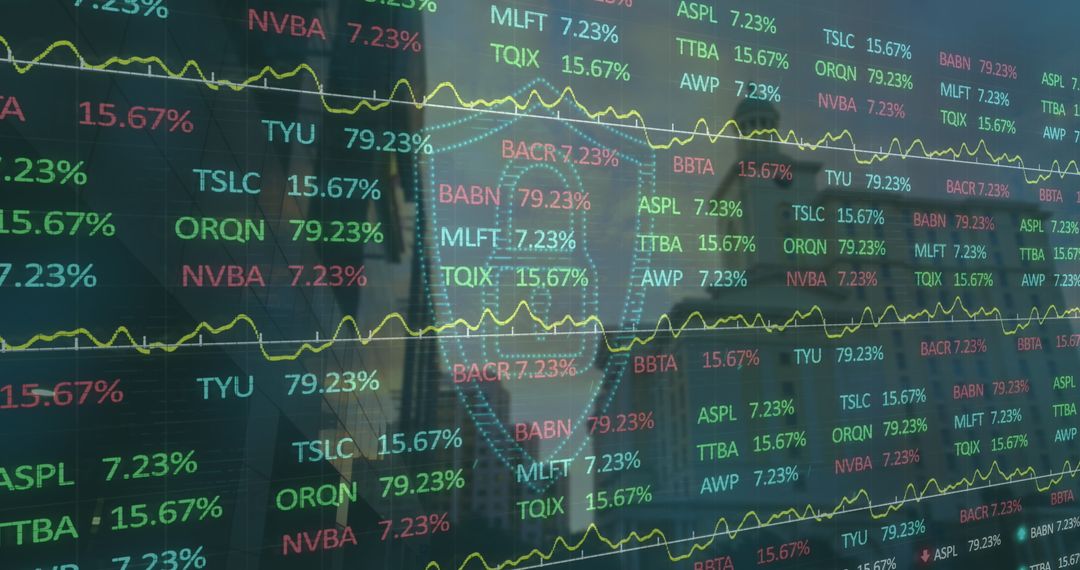
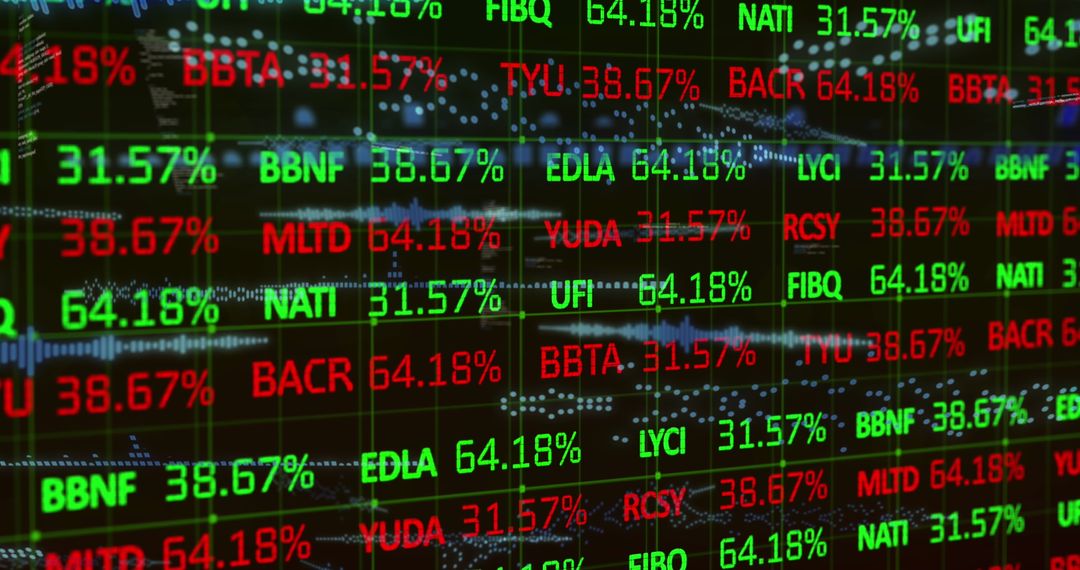
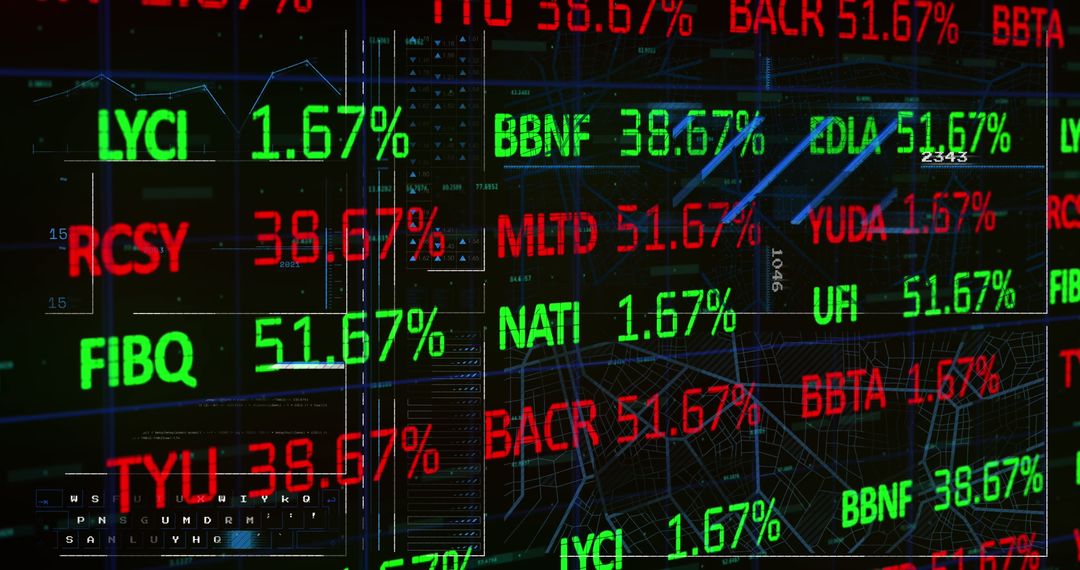
This depicts stock market data and graphical representations featuring financial indices, set against a global business theme. Bright colors highlight the dynamic changes in the market. Suitable for illustrating topics related to finance, economic trends, data analysis, and trading tools in technical presentations, reports, and multimedia content.
Powered by 


2
downloads
downloads
Tags:
More
Credit Photo
If you would like to credit the Photo, here are some ways you can do so
Text Link
photo Link
<span class="text-link">
<span>
<a target="_blank" href=https://pikwizard.com/photo/dynamic-stock-market-data-visualization-with-global-financial-indicators/56340859d6e0d58d9d69a540025db16a/>PikWizard</a>
</span>
</span>
<span class="image-link">
<span
style="margin: 0 0 20px 0; display: inline-block; vertical-align: middle; width: 100%;"
>
<a
target="_blank"
href="https://pikwizard.com/photo/dynamic-stock-market-data-visualization-with-global-financial-indicators/56340859d6e0d58d9d69a540025db16a/"
style="text-decoration: none; font-size: 10px; margin: 0;"
>
<img src="https://pikwizard.com/pw/medium/56340859d6e0d58d9d69a540025db16a.jpg" style="margin: 0; width: 100%;" alt="" />
<p style="font-size: 12px; margin: 0;">PikWizard</p>
</a>
</span>
</span>
Free (free of charge)
Free for personal and commercial use.
Author: Authentic Images
Similar Free Stock Images

Premium


Premium


Premium


Premium


Premium


Premium


Premium


Premium


Premium


Premium


Premium


Premium


Premium


Premium


Premium


Premium


Premium


Premium


Premium


Premium


Premium


Premium


Premium


Premium