- Home >
- Stock Photos >
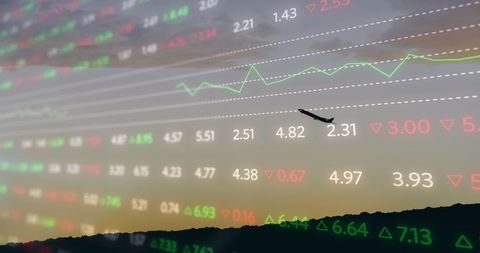
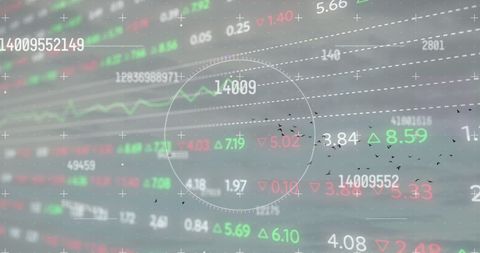
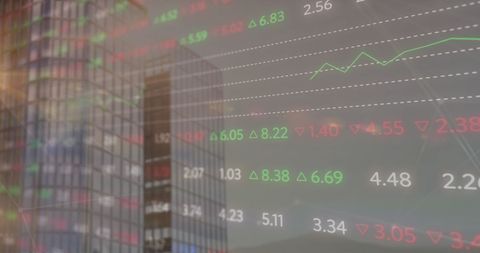
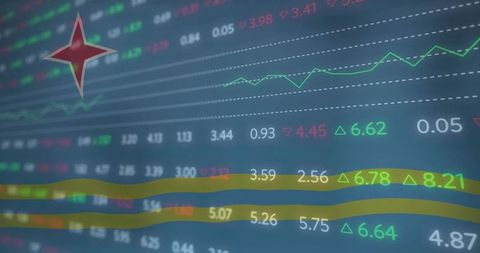
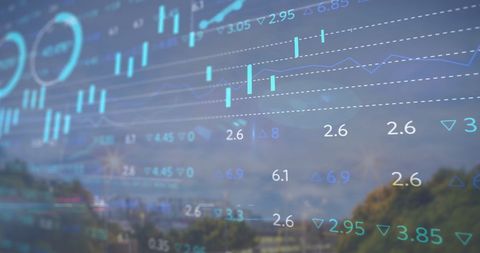
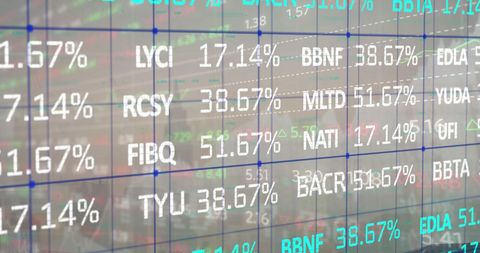
- Dynamic Stock Market Data Visualization with Global Interface
Dynamic Stock Market Data Visualization with Global Interface Image

Numeric data, stock symbols, and upward and downward arrows suggest changes in share prices, useful for presentations about economic trends or financial reports. Ideal for websites focusing on investment, finance news, or global business applications, visually representing a complex data dashboard often used by analysts and traders to evaluate financial markets.

downloads
Tags:
More
Credit Photo
If you would like to credit the Photo, here are some ways you can do so
Text Link
photo Link
<span class="text-link">
<span>
<a target="_blank" href=https://pikwizard.com/photo/dynamic-stock-market-data-visualization-with-global-interface/9f2a6af1b7793899f2bcf4610167ee2d/>PikWizard</a>
</span>
</span>
<span class="image-link">
<span
style="margin: 0 0 20px 0; display: inline-block; vertical-align: middle; width: 100%;"
>
<a
target="_blank"
href="https://pikwizard.com/photo/dynamic-stock-market-data-visualization-with-global-interface/9f2a6af1b7793899f2bcf4610167ee2d/"
style="text-decoration: none; font-size: 10px; margin: 0;"
>
<img src="https://pikwizard.com/pw/medium/9f2a6af1b7793899f2bcf4610167ee2d.jpg" style="margin: 0; width: 100%;" alt="" />
<p style="font-size: 12px; margin: 0;">PikWizard</p>
</a>
</span>
</span>
Free (free of charge)
Free for personal and commercial use.
Author: Awesome Content