1. Home > 
  2. Stock Photos > 
  3. Dynamic Stock Market Data with Analyzing Charts and Indicators

Dynamic Stock Market Data with Analyzing Charts and Indicators Image

Dynamic Stock Market Data with Analyzing Charts and Indicators

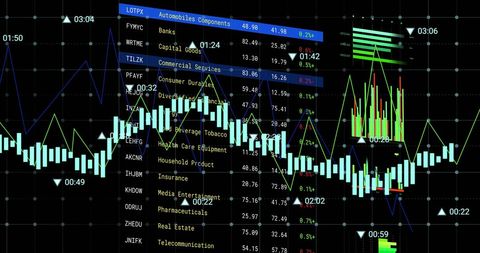
Perfect for illustrating financial analysis concepts and global stock market trends. Useful in articles about trading, business strategies, or investment education, providing a modern and professional feel for publications, corporate brochures, or digital marketing campaigns.

Powered by Adobe logo
Orange financial charts over city skyline at sunset stock market trading - Powered by AdobeRed and yellow financial graph descending against blue background with bokeh lights stock market trading - Powered by AdobeForex colorful diagrams and stock market data with lines and dynamics - Powered by AdobeDigital glowing stock market chart with options trend and index data on a dark background, symbolizing economic growth, trading, and financial technology. - Powered by AdobeFinancial market data and trading charts on a computer screen - Powered by Adobe

Credit Photo

If you would like to credit the Photo, here are some ways you can do so

Free (free of charge)

Free for personal and commercial use.

Author: Creative Art

Similar Free Stock Images

Loading...
Digital Finance Data Overlaying Futuristic Cityscape
Premium

Dynamic blue and green digital stock market graph with bar charts and lines on a dark background, representing financial data analysis, investment trends, business growth, and global economy fluctuat
Financial Data Overlay on Cityscape Visualizing Market Trends
Dynamic Financial Graphs Over Cityscape Background
Dynamic Digital Data Analysis on Elevated Grid
Rising Digital Graph and Data Visualizations on Black Background
Data Analytics and Financial Growth Indicators
Economic Trends Analysis with Financial Indicators and Graphs
Premium
Businessman using tablet analyzing stock market data with city skyline background
Premium
Electric power transmission tower at sunset with overlay of financial stock market data charts
Dynamic Financial Charts and Graphs Indicating Market Trends
Financial Data Processing with Digital Patterns for Global Business
Digital Financial Data Overlay on Urban Street Scene
Premium
Two young men sit at a desk in a dimly lit office, discussing financial data displayed on multiple screens while analyzing stock market trends and investment opportunities.
Premium
Close up of a finger touching a digital financial stock market graph on a screen
Graph Showing Stock Market Activity and Financial Data Analysis
Digital Stock Market Analysis with Graphs and Charts
Digital Data Visualization with Trend Lines and Percentage Changes
Financial Growth Graph and Data Analytics Representation
Dynamic Data Visualization with Financial Charts and 3D Elements
Abstract Financial Data Visualization with Graphs
Digital Graph with Rising and Falling Lines on Grid Background
Digital Data Visualization and Analysis Interface
Premium
young indian business man trader wearing glasses looking at computer screen with trading charts reflecting in eyeglasses watching stock trading market financial data growth concept close up no logos
Financial Data Analysis on Blue Digital Interface
Dynamic Stock Market Data Analysis With Graphs and Percentages
Dynamic Financial Graphs Overlaying Modern Cityscape
Dynamic Financial Data Overlaid on Grid Background
Premium
Financial trading graph with candlestick chart and binary data on dark blue digital background depicting global market trends. 3D Rendering
Abstract Digital Data Graph and Diagrams on Gray Background
Global Cyber Security Data Interface on Dark Background
Dynamic Stock Market Graphs Indicating Financial Trends
Digital Financial Data and Global Business Analytics
Digital Stock Market Trends and Financial Growth Analysis
Financial Data Visualization with Cityscape Overlay
Global Financial Data Analysis with World Map Visualization
Dynamic Green Stock Chart on Digital Grid Background
Futuristic Digital Interface with Spiraling Coding Patterns
Premium
Businessman analyzing financial market data on a digital screen with a pen and stock charts in a high-tech office environment for investment and trading analysis
Fluctuating Digital Stock Market Data Chart
Digital Financial Data with Graph and Grid Patterns
Digital Financial Data Analysis with Graphs and Stock Market Trends
Dynamic Data Visualization and Financial Growth Curves
Dynamic Financial Growth Digital Chart Display
Data Analytics Graphs on Digital Interface Background
Dynamic Financial Data Chart Display with Graphical Analysis
High-Tech Financial Data Analysis Display with Graphs
Digital Stock Market Chart and Networking Interface
Premium
Golden key unlocking a digital stock market chart technology access
Financial Data Processing with Rising Graphs
Financial Graphs with Social Media Analytics on Digital Chart
Dynamic Financial Data Visualization on Digital Grid Background
Holographic Financial Data Visualization with Stock Trends
Premium
Stock market trading chart and analyzing investment opportunity. Broker touching stock exchange price graphs.
Abstract Digital Stock Market Analysis with Graphs
Data Analysis Graphics on Digital Grid Background
Dynamic Stock Market Analysis Concept Artwork
Analyzing Financial Data on Digital World Map Background
Premium
Dynamic financial growth overlaid on American flag, symbolizing economic prosperity and national progress.
Digital Interface Displaying Data Processing and Analytics Visuals
Financial Graph with Data Analysis and Market Statistics
Dynamic Graphic of Financial Data Displayed on Graph
Dynamic Digital Stock Market Ticker with Growing Graph Trends
Financial Data Visualization Over Futuristic Cityscape
Premium
Financial data charts with glowing stock and forex graphs on a dark background illuminated in blue tones. 3D Rendering
Digital Financial Data Overlaying City Skyline at Dusk
Dynamic Financial Data Visualization over Urban Silhouette
Financial Data Flow against Urban Skyline Backdrop
Premium
Stockmarket online trading chart candlestick on crypto currency platform. Stock exchange financial market price candles graph data pattern analysis concept. Computer screen closeup background
Futuristic Global Business Data with Digital Interface
Digital Finance: Modern Stock Market Analysis Display
Digital Data Visualization with Blue Grid and Timeline
Abstract Digital Interface for Medical Data Processing
Premium
Business financial chart with moving up arrow graph.Financial data charts with glowing stock market graphs.Stock market investment data and analysis finance graph.
Digital Financial Data Analysis with Infographics and Charts
Financial Data Analysis Displayed on Server Infrastructure
Rising Graphs and Interactive Financial Data Analytics Background
Dynamic Business Data and Cityscape Visualization
Premium
Stethoscope on financial stock market graph with warm light
Dynamic Financial Data Analysis in Digital Interface
Data Analysis with Advanced Technology Interface Details Profusion
Colorful Bar Graph with Data Overlay on Black Background
Rising Financial Data Graph on Digital Grid Background
Premium
Man analyzing financial data on multiple screens
Dynamic Financial Data Against Urban Skyline
Digital Chart Display Financial Data Analysis Background Effects
Digital Cityscape with Financial Data Overlay
Digital Data and Financial Charts on White Background
Premium
Hand pointing at a world map with stock market charts and data overlays indicating global financial activity
Tech Growth Analysis with Dynamic Data Visualization
Digital Financial Data Analysis on Grid Framework
Futuristic Digital Data Analysis Interface Visualization
Dynamic Financial Data with Fluctuating Graph Lines
Premium
Data analyzing and stock market visualization with digital charts, financial dashboards, and performance metrics. Ideal for investment analysis, trading strategy, and economic forecasting.
Dynamic Financial Data Graphs Networking in Global Business
Financial Data Streaming with Arrows Over Graphic Indicators
Digital Financial Data Visualization with Urban Cityscape
Premium
Hand interacting with financial stock market trading candlestick charts analyzing growth opportunities and investment strategies
Premium
Close-up of businesswoman eyes, wearing glasses with blue tint, focusing on financial charts. Woman face is framed by gray background, emphasizing her eyes and glasses. Financial data analysis.
Dynamic Financial Graphs Illustrating Market Trends
Financial Stock Market Data Analysis on Digital Interface
Futuristic Data Processing Animation with Media Icons
Dynamic Stock Market Analytics Display on Blue Background
Dynamic Financial Graph on Digital Background
Data Security with Tech Bar Graph Overlay
Analyzing Data Trends on Digital Graph Interface
Premium
Upward trending financial graph with rising stock market bars and arrow
Digital Graphs Representing Data and Analytics on Black Background
Financial Data Analysis with Code Interface on Black Background
Abstract Digital Financial Data Chart with Pink Line Oscillations
Dynamic Forex Trading Graphs with Increasing Numbers
Holographic Charts with Social Media Notifications
Premium
Stock market chart with candlesticks and line graph. Financial data analysis on blurred city background. Investment and trading concept for business strategy and economic growth
Premium
Business people with stock market chart financial trading, online investment, stock exchange analysis, market trends, real-time trading data, forex and crypto trading economic forecasting tool
Abstract Digital Charts with Social Media Metrics Rising
Data Visualization on Security Shield Interface for Cyber Security
Dynamic Financial Graphs and Data Analysis Interface
Holographic Financial Stock Market Analysis Visualization
Premium
Abstract financial illustration of candle chart data showing trading trends and market volatility
NFT Financial Data Visualization with Digital Graph Overlay
Financial Data Analysis with Interactive Graphs
Fluctuating Financial Graph on Green Grid Background
Abstract Financial Data Processing and Analysis Interface
Premium
Smiling business woman uses tablet analyzing stock market data at night. Financial growth graphs, data trends overlaid on screen. Successful trader investor monitors investment performance on digital
Digital Financial Data Graph on Black Screen Background