- Home >
- Stock Photos >
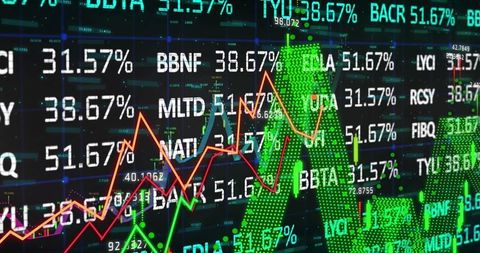
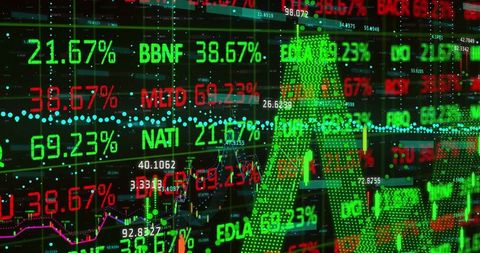
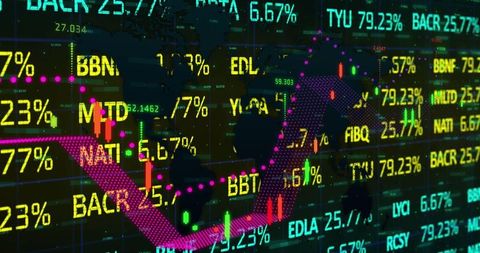
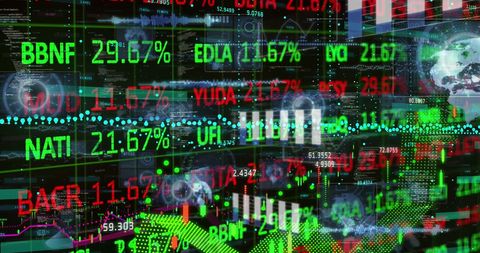
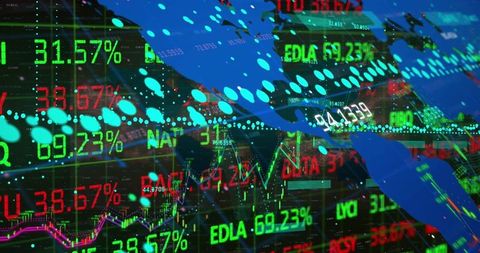
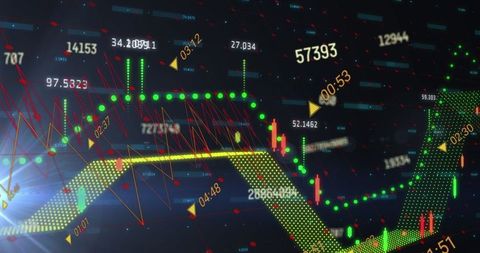
- Dynamic Stock Market Data With Digital Interfaces
Dynamic Stock Market Data With Digital Interfaces Image

This representation of a dynamic stock market interface, showcasing candlestick bars and arrows, is ideal for tech and financial industry materials. Perfect for illustrating concepts in finance, data analysis, investment apps, trading platforms, and digital innovation presentations. Useful in reports, educational content highlighting analytics, and discussions on the intersection of technology and financial markets.

downloads
Tags:
More
Credit Photo
If you would like to credit the Photo, here are some ways you can do so
Text Link
photo Link
<span class="text-link">
<span>
<a target="_blank" href=https://pikwizard.com/photo/dynamic-stock-market-data-with-digital-interfaces/aac102d902175c44b5ae5ddb1df00643/>PikWizard</a>
</span>
</span>
<span class="image-link">
<span
style="margin: 0 0 20px 0; display: inline-block; vertical-align: middle; width: 100%;"
>
<a
target="_blank"
href="https://pikwizard.com/photo/dynamic-stock-market-data-with-digital-interfaces/aac102d902175c44b5ae5ddb1df00643/"
style="text-decoration: none; font-size: 10px; margin: 0;"
>
<img src="https://pikwizard.com/pw/medium/aac102d902175c44b5ae5ddb1df00643.jpg" style="margin: 0; width: 100%;" alt="" />
<p style="font-size: 12px; margin: 0;">PikWizard</p>
</a>
</span>
</span>
Free (free of charge)
Free for personal and commercial use.
Author: People Creations