- Home >
- Stock Photos >
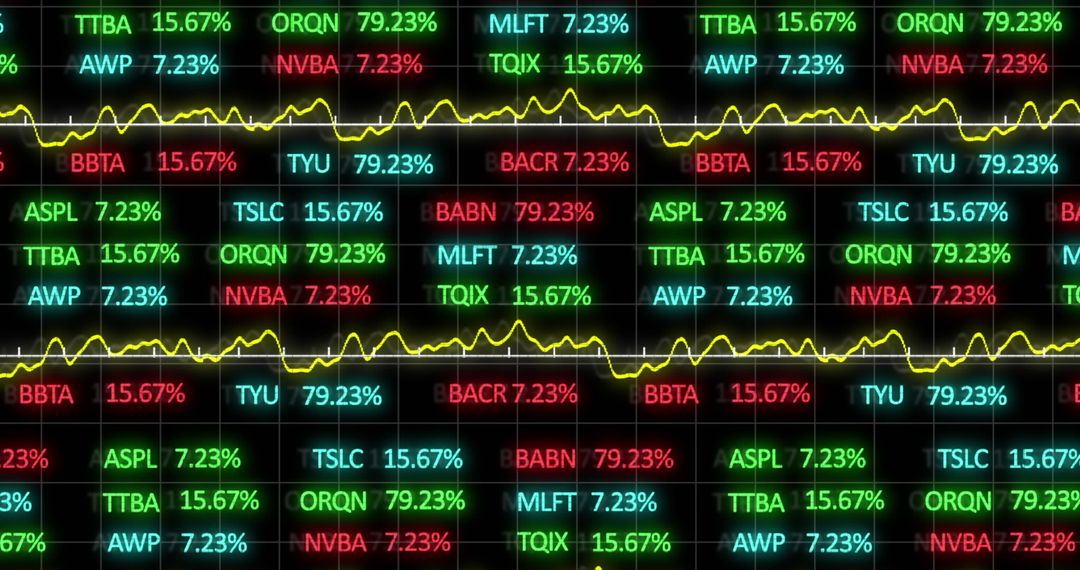
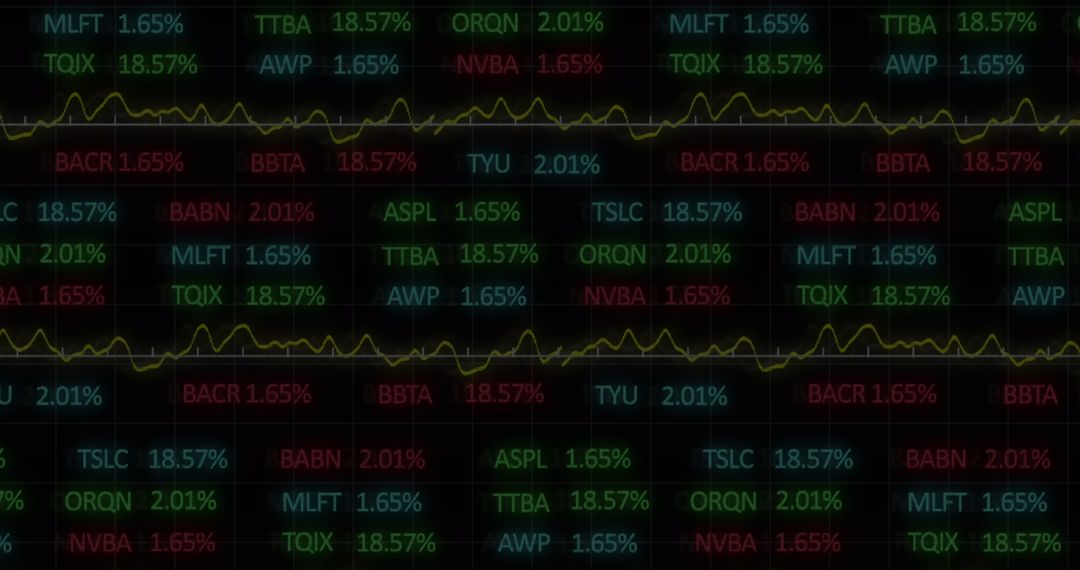
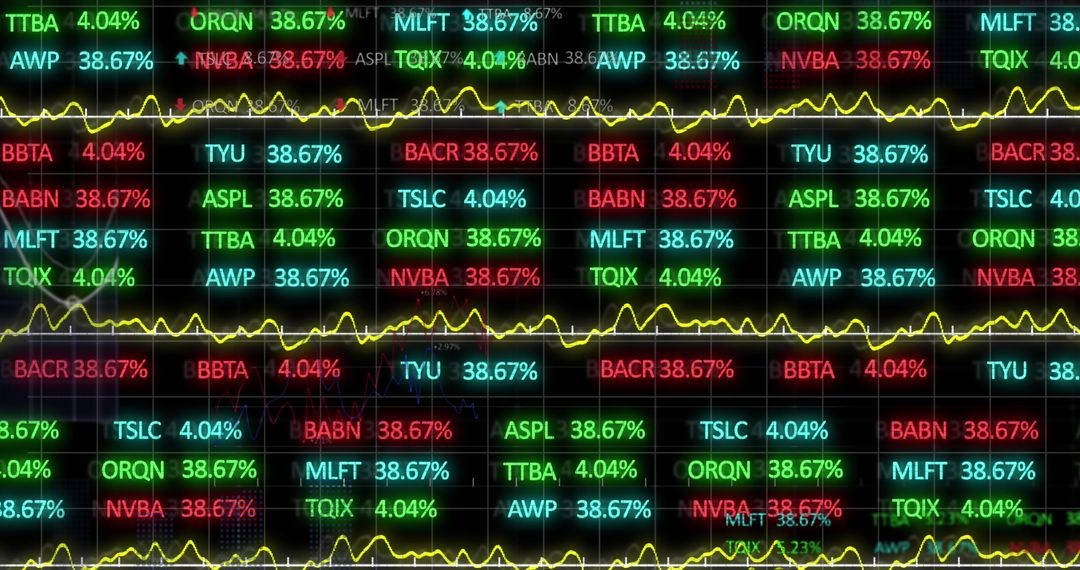
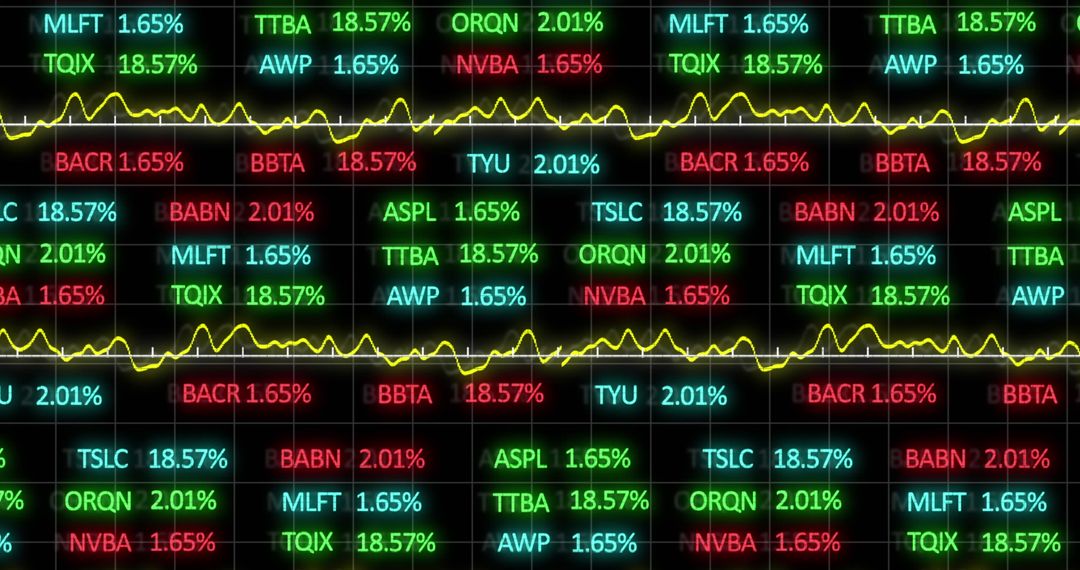
- Dynamic Stock Market Data With Digital Trading Analysis
Dynamic Stock Market Data With Digital Trading Analysis Image

Colorful electronic stock data displays various percentages and letters representing different financial assets. Colored outlines with digitized numbers indicate volatility and trading patterns, symbolizing activity in global economic markets. Useful for illustrating concepts in finance, investment analysis, electronic trading, market strategy, and economic forecasts.
Powered by 


2
downloads
downloads
Tags:
More
Credit Photo
If you would like to credit the Photo, here are some ways you can do so
Text Link
photo Link
<span class="text-link">
<span>
<a target="_blank" href=https://pikwizard.com/photo/dynamic-stock-market-data-with-digital-trading-analysis/1bd34efe1b6db386449ad02d39e121e6/>PikWizard</a>
</span>
</span>
<span class="image-link">
<span
style="margin: 0 0 20px 0; display: inline-block; vertical-align: middle; width: 100%;"
>
<a
target="_blank"
href="https://pikwizard.com/photo/dynamic-stock-market-data-with-digital-trading-analysis/1bd34efe1b6db386449ad02d39e121e6/"
style="text-decoration: none; font-size: 10px; margin: 0;"
>
<img src="https://pikwizard.com/pw/medium/1bd34efe1b6db386449ad02d39e121e6.jpg" style="margin: 0; width: 100%;" alt="" />
<p style="font-size: 12px; margin: 0;">PikWizard</p>
</a>
</span>
</span>
Free (free of charge)
Free for personal and commercial use.
Author: Creative Art
Similar Free Stock Images

Premium


Premium


Premium


Premium


Premium


Premium


Premium


Premium


Premium


Premium


Premium


Premium


Premium


Premium


Premium


Premium


Premium


Premium


Premium


Premium


Premium


Premium


Premium


Premium