- Home >
- Stock Photos >
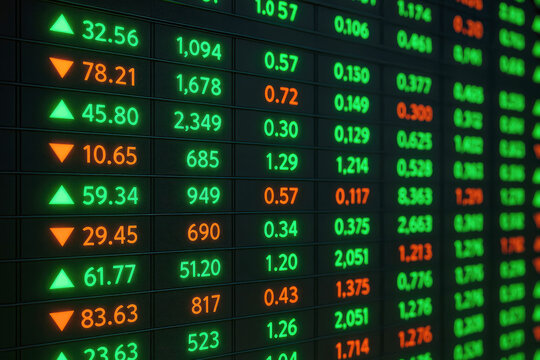
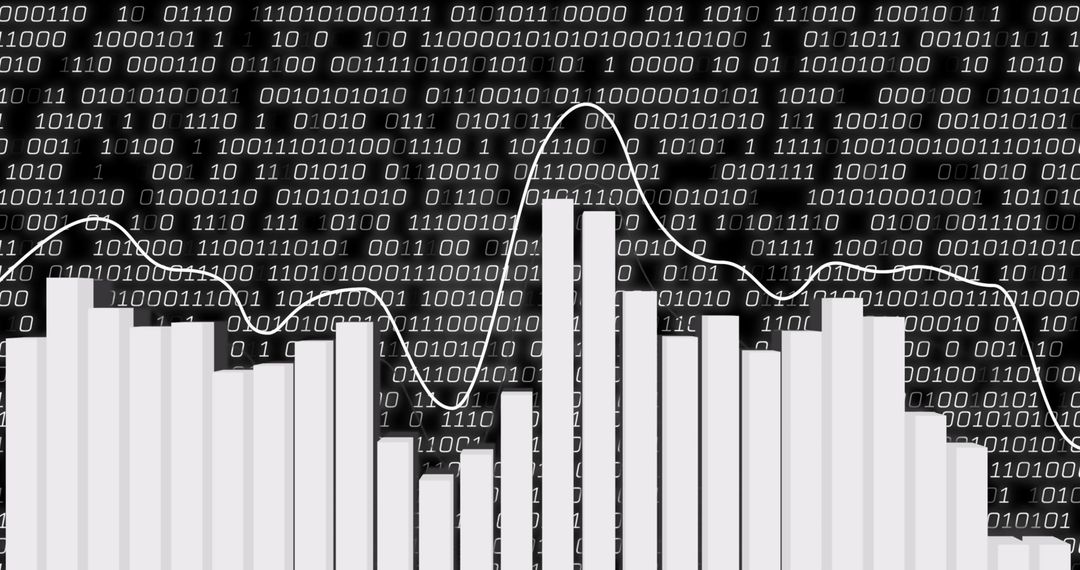
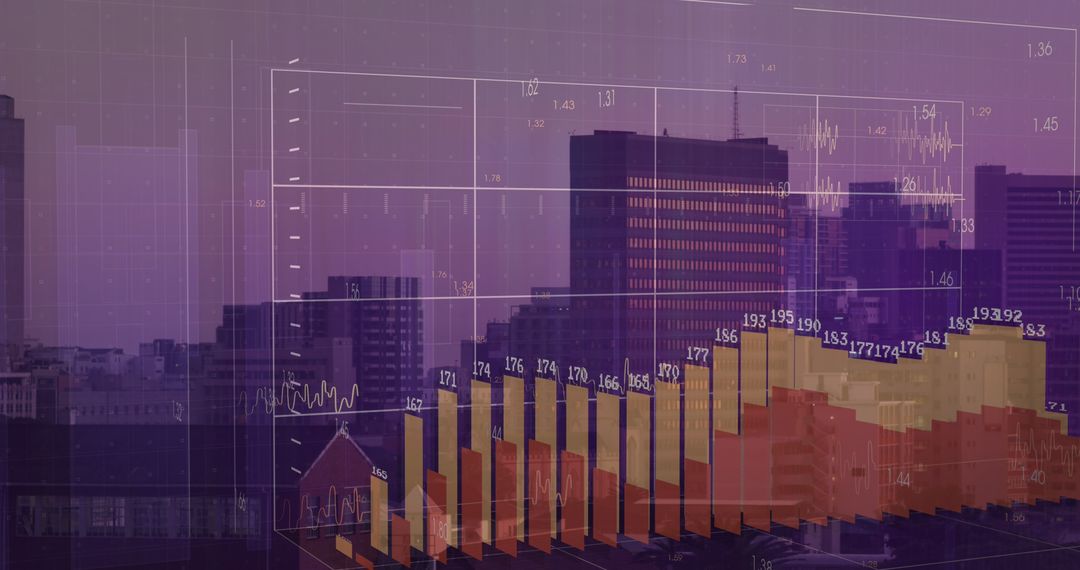
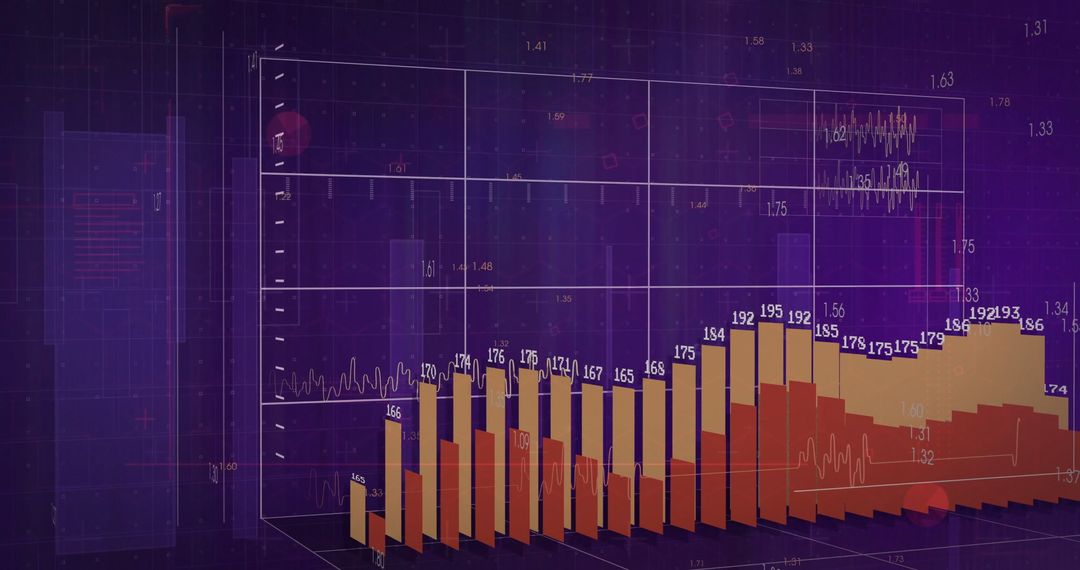
- Dynamic Stock Market Data with Engineer in High-Tech Server Room
Dynamic Stock Market Data with Engineer in High-Tech Server Room Image

A graph displaying statistical and stock market data figures is superimposed over an engineer working in a state-of-the-art server room. The scene emphasizes themes of digital transformation and technological advancement. This visual can be used in business presentations or technology-related content where data analysis and modern infrastructure is highlighted for investments or academic purposes.
Powered by 


2
downloads
downloads
Tags:
More
Credit Photo
If you would like to credit the Photo, here are some ways you can do so
Text Link
photo Link
<span class="text-link">
<span>
<a target="_blank" href=https://pikwizard.com/photo/dynamic-stock-market-data-with-engineer-in-high-tech-server-room/e42593d1894f78de5718a9290b44aa6c/>PikWizard</a>
</span>
</span>
<span class="image-link">
<span
style="margin: 0 0 20px 0; display: inline-block; vertical-align: middle; width: 100%;"
>
<a
target="_blank"
href="https://pikwizard.com/photo/dynamic-stock-market-data-with-engineer-in-high-tech-server-room/e42593d1894f78de5718a9290b44aa6c/"
style="text-decoration: none; font-size: 10px; margin: 0;"
>
<img src="https://pikwizard.com/pw/medium/e42593d1894f78de5718a9290b44aa6c.jpg" style="margin: 0; width: 100%;" alt="" />
<p style="font-size: 12px; margin: 0;">PikWizard</p>
</a>
</span>
</span>
Free (free of charge)
Free for personal and commercial use.
Author: People Creations
Similar Free Stock Images

Premium


Premium


Premium


Premium


Premium


Premium


Premium


Premium


Premium


Premium


Premium


Premium


Premium


Premium


Premium


Premium


Premium


Premium


Premium


Premium


Premium


Premium


Premium


Premium