- Home >
- Stock Photos >
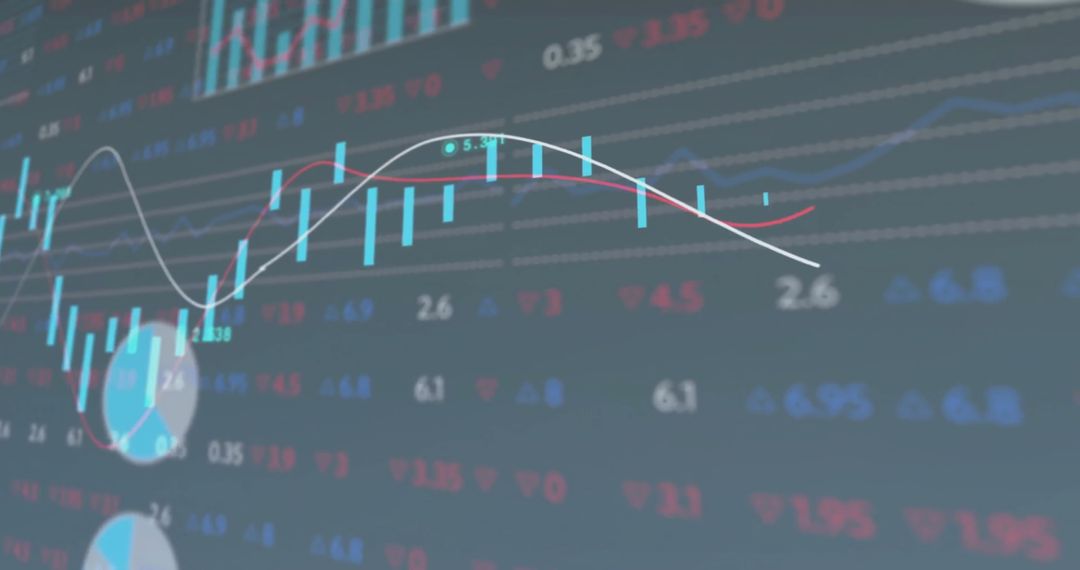
- Dynamic Stock Market Data with Global Financial Indicators
Dynamic Stock Market Data with Global Financial Indicators Image

Capturing essence of a dynamic stock market environment, this visualization highlights movement of economic data and application of technology in financial trades. Suitable for use in business presentations, financial reports, educational materials on modern economy or as banners and ads for financial firms focusing on global markets.
Powered by  - Get 15% off with code: PIKWIZARD15


2
downloads
downloads
Tags:
More
Credit Photo
If you would like to credit the Photo, here are some ways you can do so
Text Link
photo Link
<span class="text-link">
<span>
<a target="_blank" href=https://pikwizard.com/photo/dynamic-stock-market-data-with-global-financial-indicators/82e208ebbfcd44865d8416151dc65f67/>PikWizard</a>
</span>
</span>
<span class="image-link">
<span
style="margin: 0 0 20px 0; display: inline-block; vertical-align: middle; width: 100%;"
>
<a
target="_blank"
href="https://pikwizard.com/photo/dynamic-stock-market-data-with-global-financial-indicators/82e208ebbfcd44865d8416151dc65f67/"
style="text-decoration: none; font-size: 10px; margin: 0;"
>
<img src="https://pikwizard.com/pw/medium/82e208ebbfcd44865d8416151dc65f67.jpg" style="margin: 0; width: 100%;" alt="" />
<p style="font-size: 12px; margin: 0;">PikWizard</p>
</a>
</span>
</span>
Free (free of charge)
Free for personal and commercial use.
Author: People Creations
Similar Free Stock Images

Premium


Premium


Premium


Premium


Premium


Premium


Premium


Premium


Premium


Premium


Premium


Premium


Premium


Premium


Premium


Premium


Premium


Premium


Premium


Premium


Premium


Premium


Premium


Premium