
- Home >
- Stock Photos >
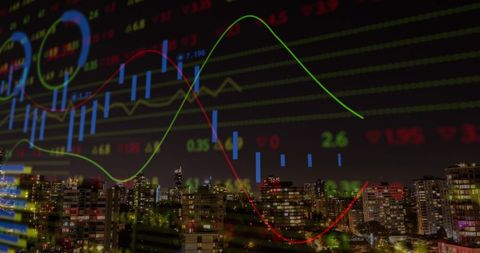
- Dynamic Stock Market Data with Graphs and Statistics
Dynamic Stock Market Data with Graphs and Statistics Image

Complex image of stock market activity showing fluctuating graphs and financial statistics, ideal for illustrating finance, investment strategies, or business analysis concepts. Perfect for use in articles, business presentations, or economic reports to emphasize dynamic market conditions and data-driven analysis.
Powered by 


downloads
Tags:
More
Credit Photo
If you would like to credit the Photo, here are some ways you can do so
Text Link
photo Link
<span class="text-link">
<span>
<a target="_blank" href=https://pikwizard.com/photo/dynamic-stock-market-data-with-graphs-and-statistics/6985b091b219ecbcc514b6e61729b51c/>PikWizard</a>
</span>
</span>
<span class="image-link">
<span
style="margin: 0 0 20px 0; display: inline-block; vertical-align: middle; width: 100%;"
>
<a
target="_blank"
href="https://pikwizard.com/photo/dynamic-stock-market-data-with-graphs-and-statistics/6985b091b219ecbcc514b6e61729b51c/"
style="text-decoration: none; font-size: 10px; margin: 0;"
>
<img src="https://pikwizard.com/pw/medium/6985b091b219ecbcc514b6e61729b51c.jpg" style="margin: 0; width: 100%;" alt="" />
<p style="font-size: 12px; margin: 0;">PikWizard</p>
</a>
</span>
</span>
Free (free of charge)
Free for personal and commercial use.
Author: Awesome Content
Similar Free Stock Images

Premium


Premium


Premium


Premium

Premium


Premium


Premium

Premium

Premium


Premium


Premium


Premium


Premium


Premium

Premium

Premium


Premium


Premium


Premium


Premium


Premium


Premium

Premium


Premium


Premium


Explore More Free Stock Images