- Home >
- Stock Photos >
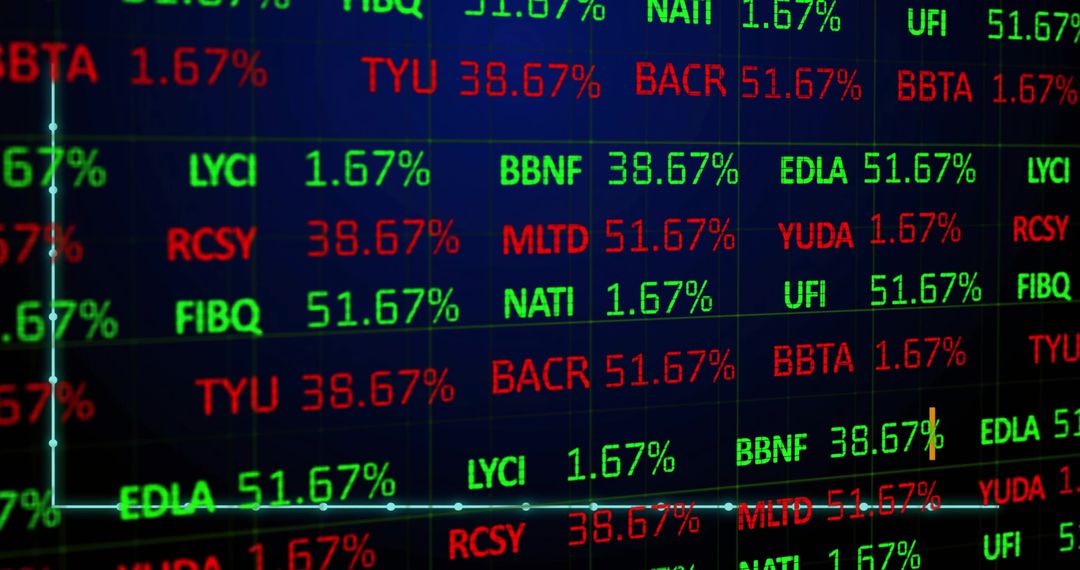
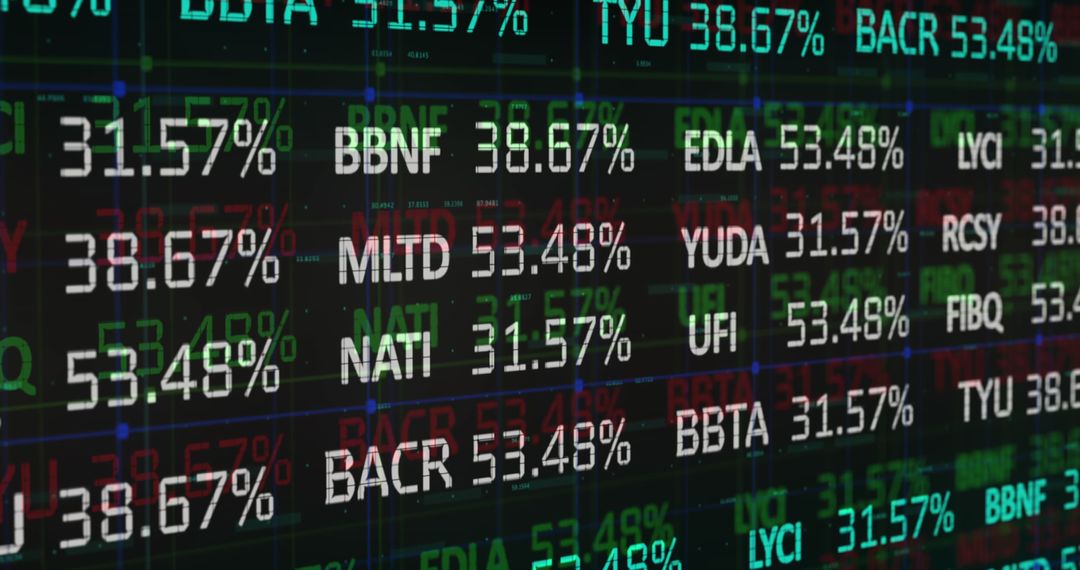
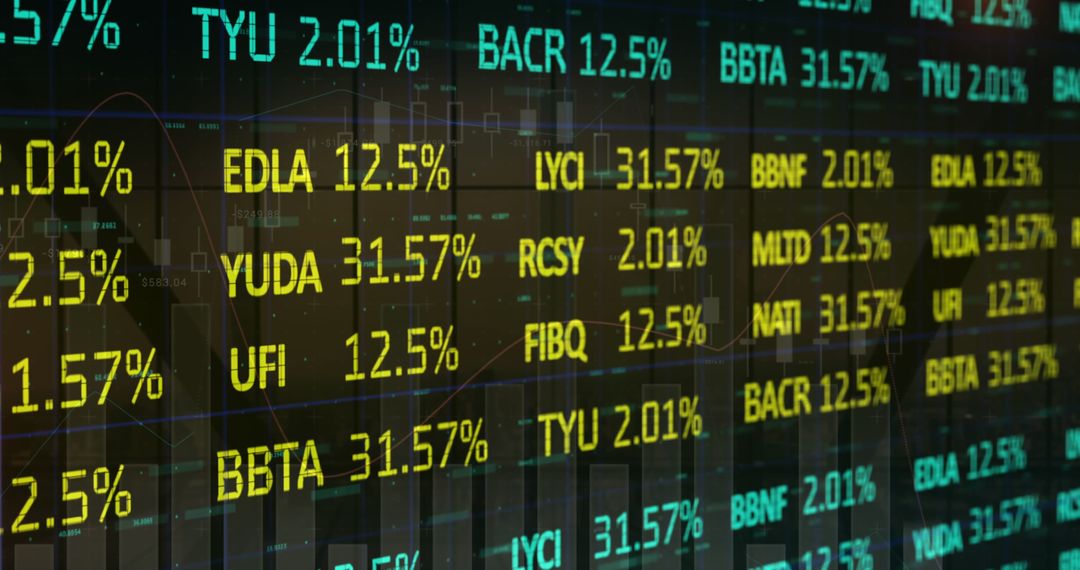
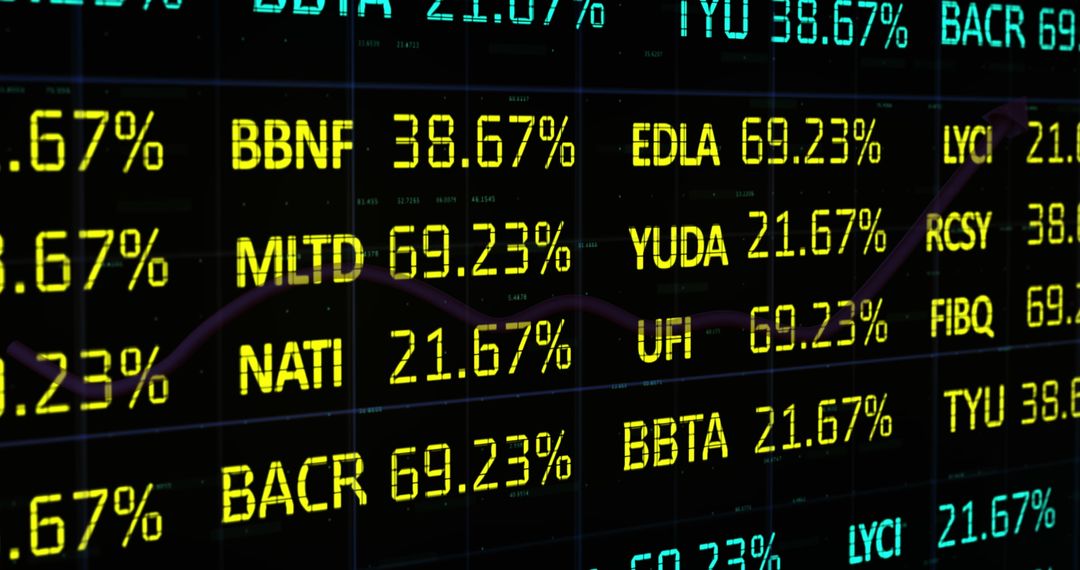
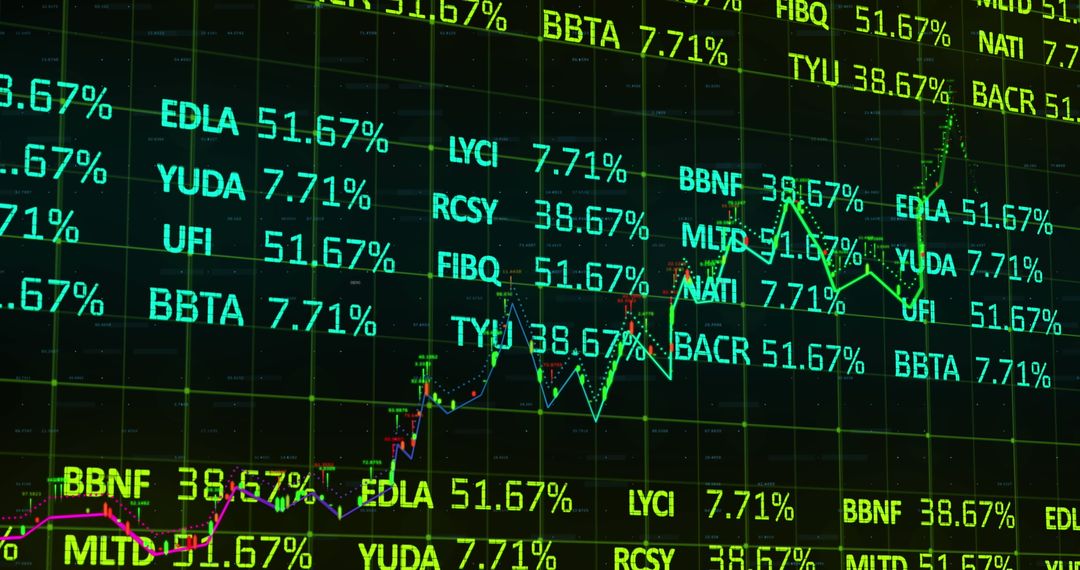
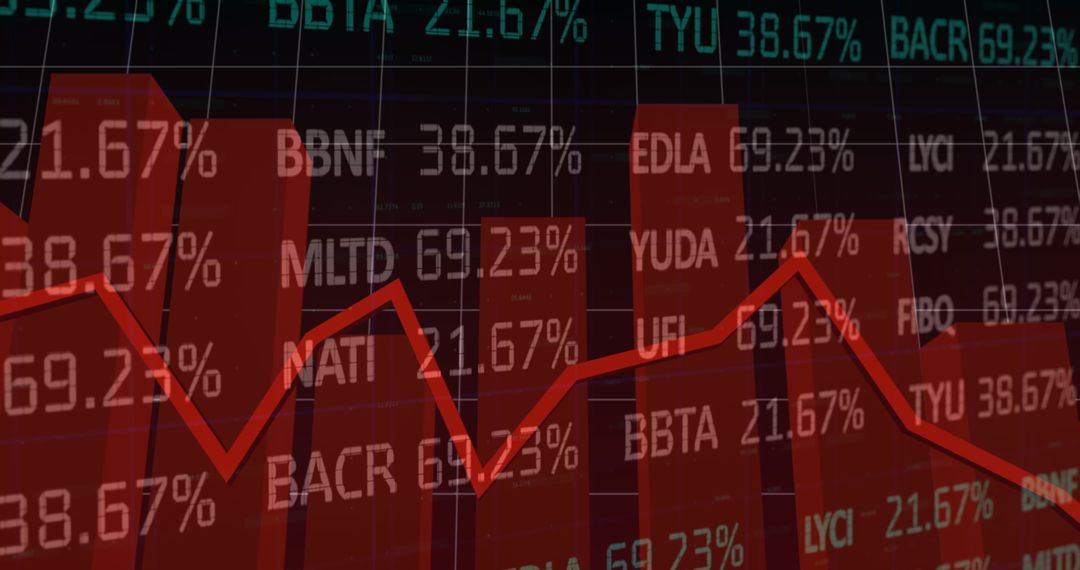
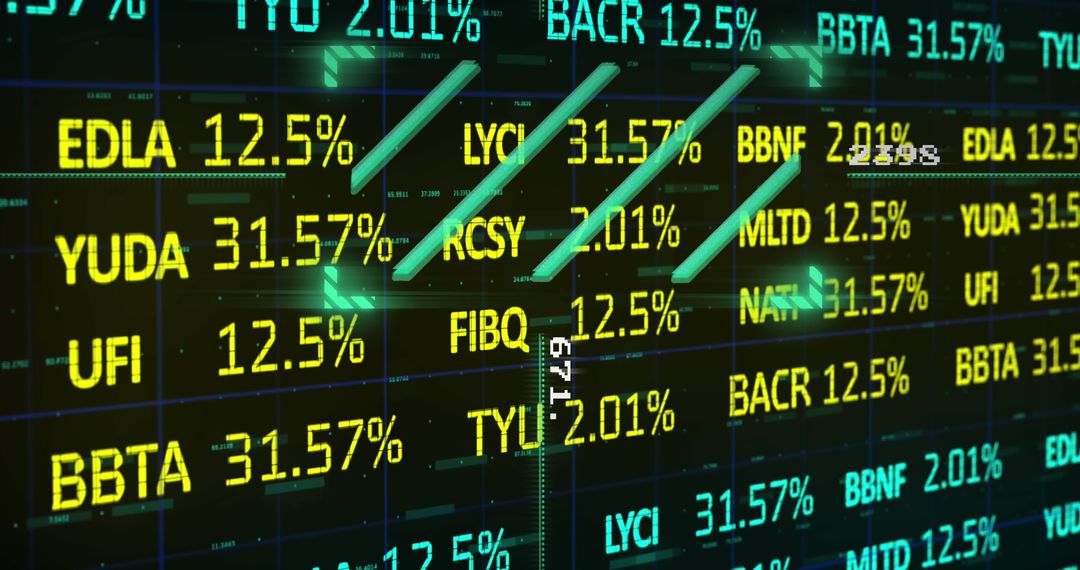
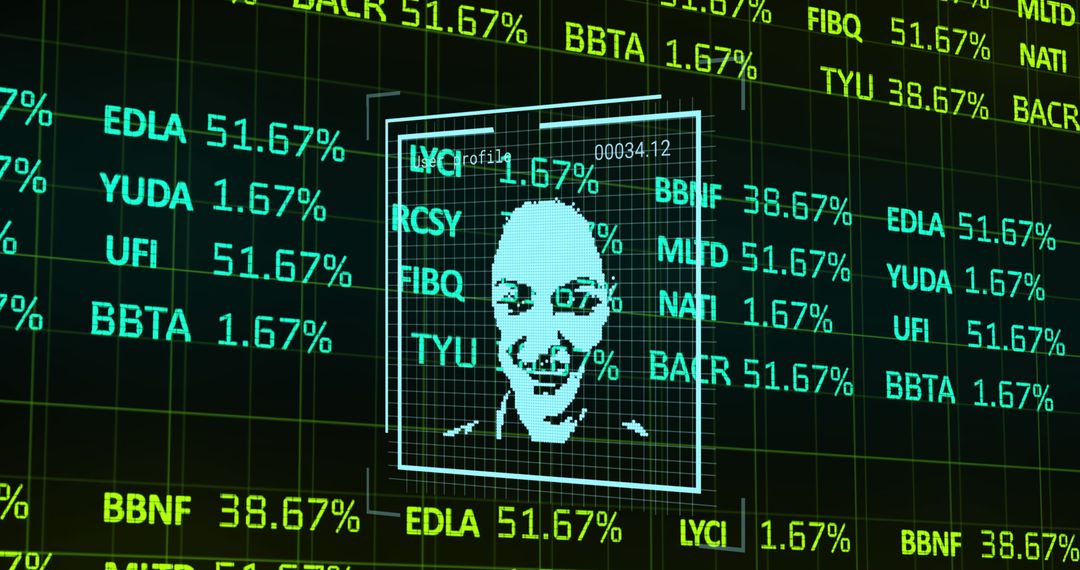
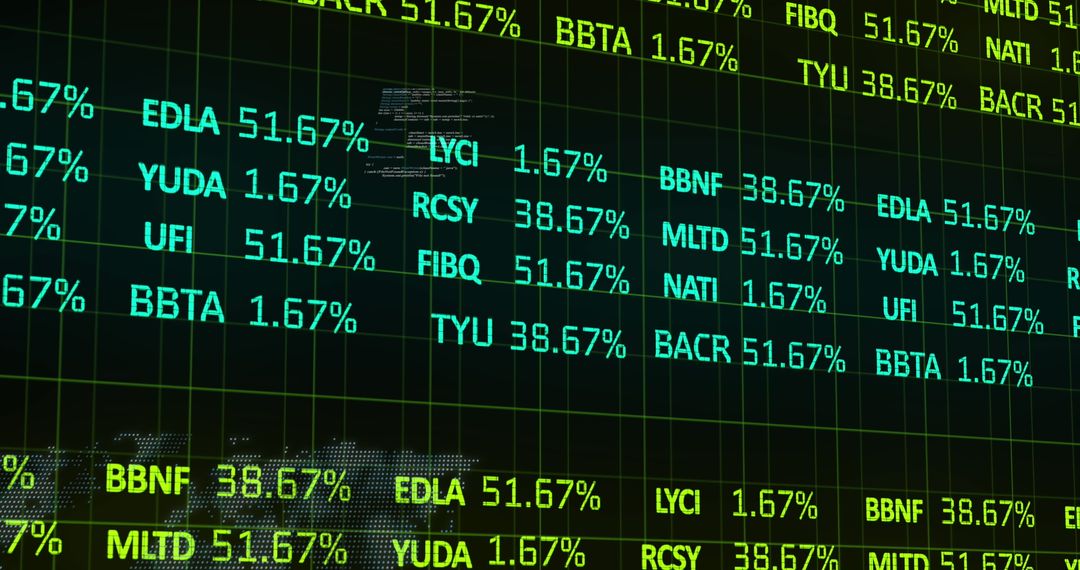
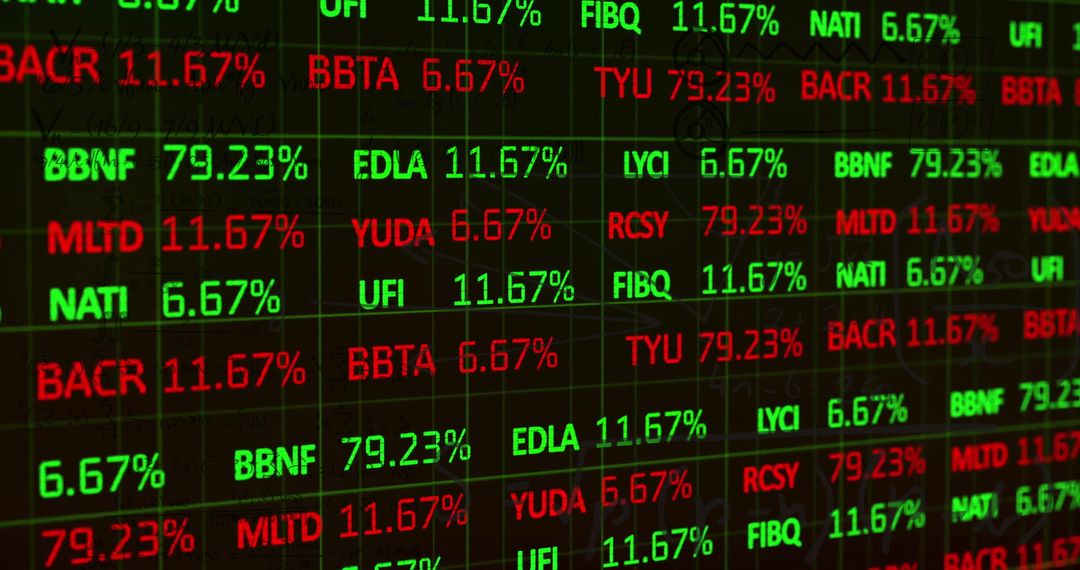
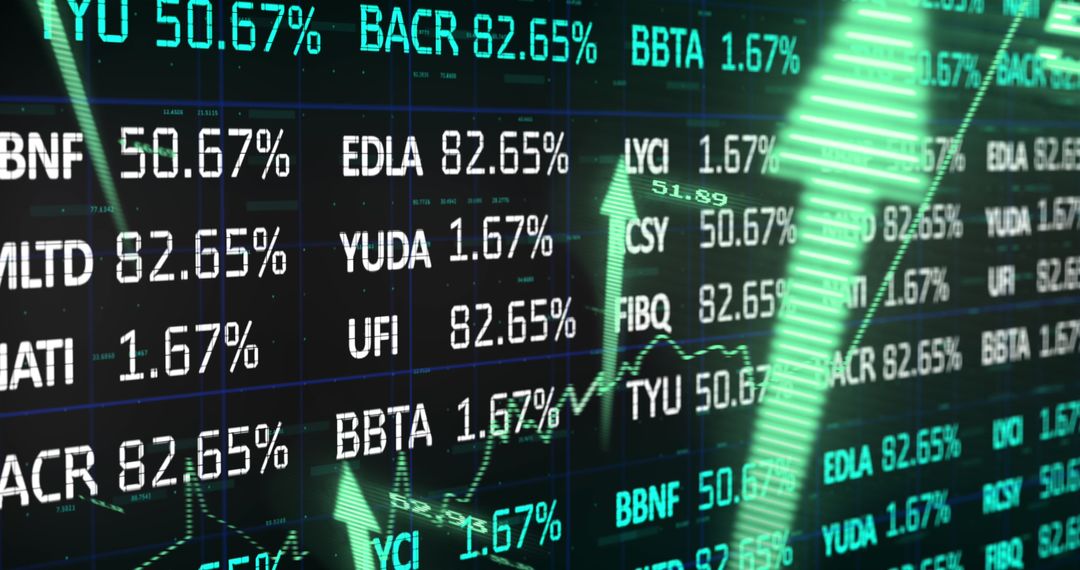
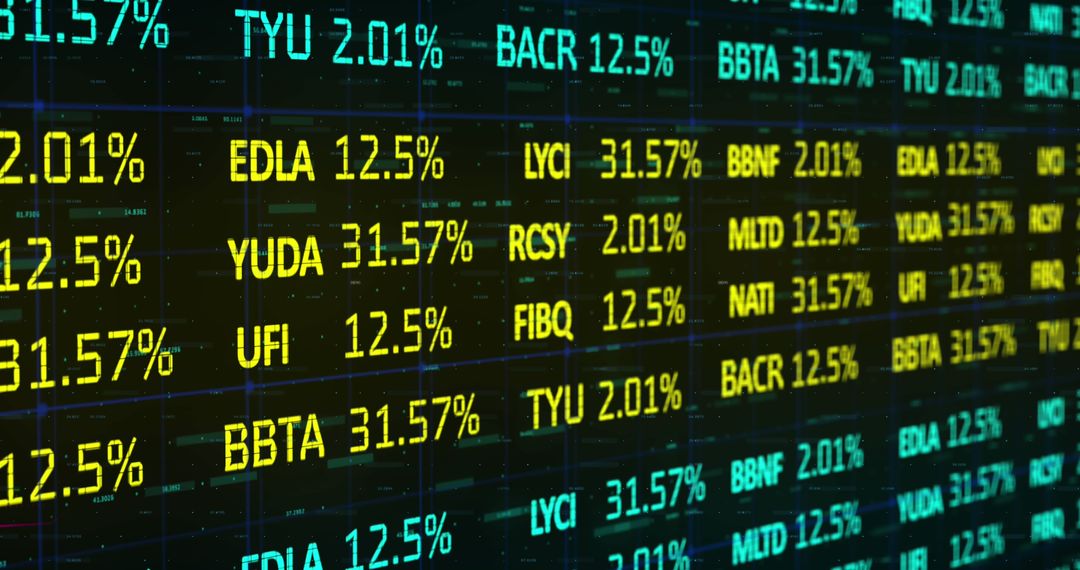
- Dynamic Stock Market Digital Display with Graphs and Statistics
Dynamic Stock Market Digital Display with Graphs and Statistics Image
Vivid portrayal of an electronic stock market board featuring rolling numbers and statistics contrasted against a grid backdrop. Graph arrows illustrated emphasize market movements, ideal for conveying dynamic financial activities or economic analysis. Useful as a background in presentations on finance, trading platforms, or investment strategies discussions.
Powered by  - Get 15% off with code: PIKWIZARD15


2
downloads
downloads
Tags:
More
Credit Photo
If you would like to credit the Photo, here are some ways you can do so
Text Link
photo Link
<span class="text-link">
<span>
<a target="_blank" href=https://pikwizard.com/photo/dynamic-stock-market-digital-display-with-graphs-and-statistics/33d9c83440ecd1b2a14de0f34221e2b3/>PikWizard</a>
</span>
</span>
<span class="image-link">
<span
style="margin: 0 0 20px 0; display: inline-block; vertical-align: middle; width: 100%;"
>
<a
target="_blank"
href="https://pikwizard.com/photo/dynamic-stock-market-digital-display-with-graphs-and-statistics/33d9c83440ecd1b2a14de0f34221e2b3/"
style="text-decoration: none; font-size: 10px; margin: 0;"
>
<img src="https://pikwizard.com/pw/medium/33d9c83440ecd1b2a14de0f34221e2b3.jpg" style="margin: 0; width: 100%;" alt="" />
<p style="font-size: 12px; margin: 0;">PikWizard</p>
</a>
</span>
</span>
Free (free of charge)
Free for personal and commercial use.
Author: Authentic Images
Similar Free Stock Images
Premium

Premium


Premium


Premium


Premium


Premium


Premium


Premium


Premium


Premium


Premium


Premium


Premium


Premium


Premium


Premium


Premium


Premium


Premium


Premium


Premium


Premium


Premium


Premium