1. Home > 
  2. Stock Photos > 
  3. Dynamic Stock Market Display with Analyzing Graphs

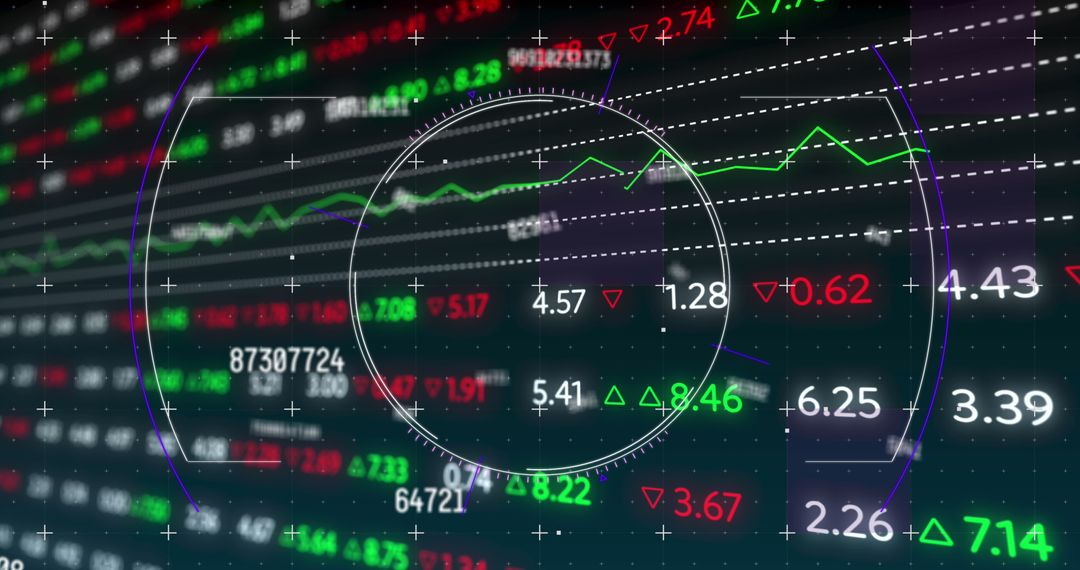
Dynamic Stock Market Display with Analyzing Graphs Image

Dynamic Stock Market Display with Analyzing Graphs

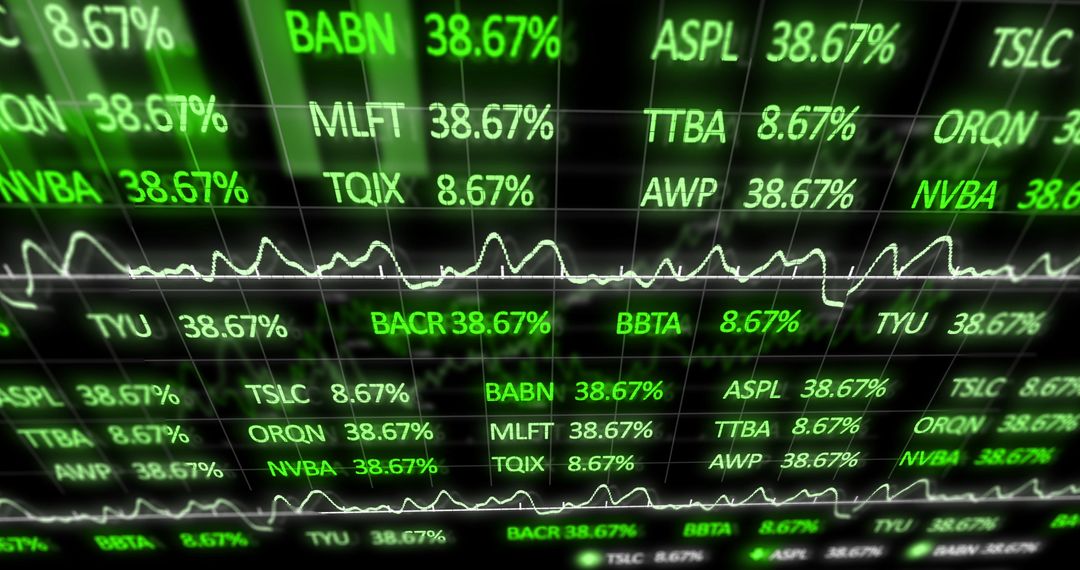
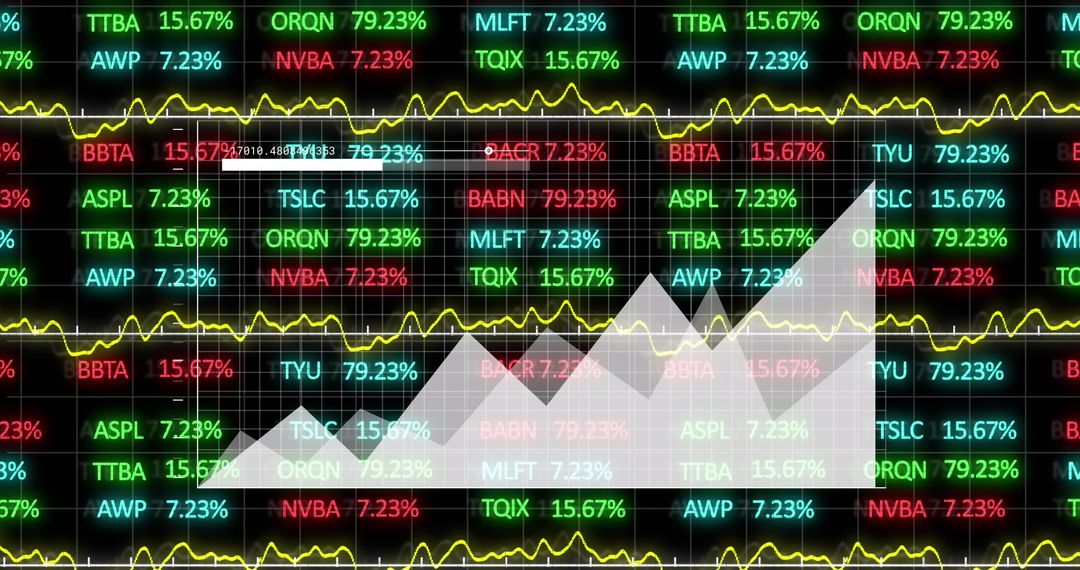
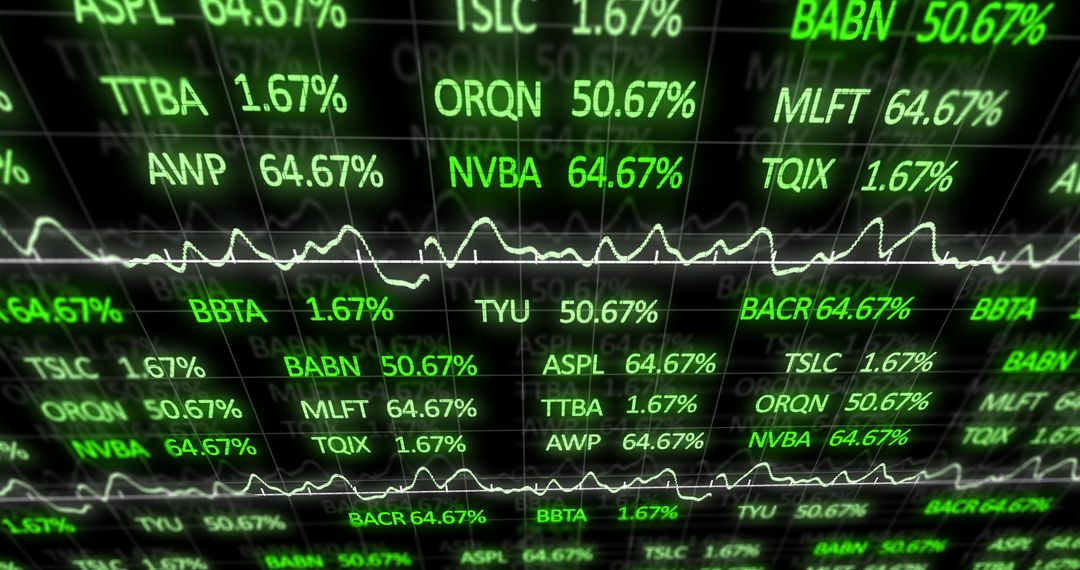
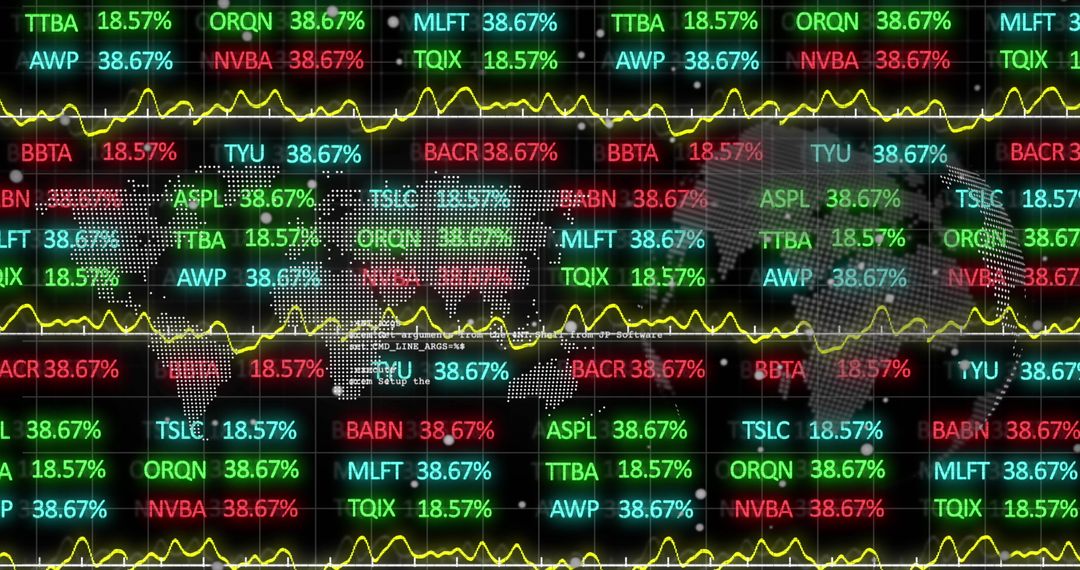
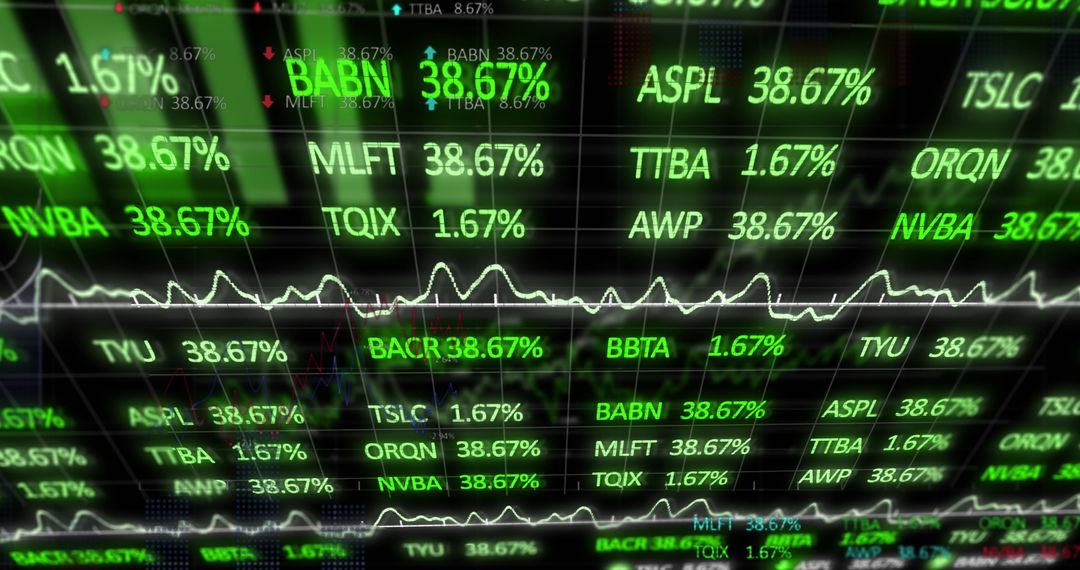
Vibrant visualization of changing stock market trends against a dark backdrop, with colorful graphs depicting dynamic economic data. Ideal for representing global finance topics, this can be used in financial websites, economic reports, business presentations, and educational materials exploring data analysis and stock market behavior.

Powered by Adobe logo
Chess pieces on board with financial graphs overlay. Business strategy concept, decision making, competitive analysis, investment planning visualized through strategic game setup, market data. - Powered by AdobeData analyzing and stock market visualization with digital charts, financial dashboards, and performance metrics. Ideal for investment analysis, trading strategy, and economic forecasting. - Powered by AdobeSmiling business woman uses tablet analyzing stock market data at night. Financial growth graphs, data trends overlaid on screen. Successful trader investor monitors investment performance on digital - Powered by Adobe
Dynamic blue and green digital stock market graph with bar charts and lines on a dark background, representing financial data analysis, investment trends, business growth, and global economy fluctuat - Powered by AdobeThe magnifying glass highlighting financial data and market trends on paper. - Powered by Adobe

Credit Photo

If you would like to credit the Photo, here are some ways you can do so

Free (free of charge)

Free for personal and commercial use.

Author: Authentic Images

Similar Free Stock Images

Dynamic Stock Market Data Visual Collage
Premium
Close-up of businesswoman eyes, wearing glasses with blue tint, focusing on financial charts. Woman face is framed by gray background, emphasizing her eyes and glasses. Financial data analysis.
Financial Data Streaming with Arrows Over Graphic Indicators
Stock Market Data Graphics on Modern Building Background
Financial Data Processing Interface with Radar Style Graphics
Digital Interface with Financial Data Displayed on Screen
Premium
ESG, Environment and Investment Green plants growing in front of financial graphs and charts.
Dynamic Stock Market Data Overlaying Urban Landscape
Green Line Rising on Digital Trading Board with Abstract Background
Digital Financial Data with Rising Trends Display
Dynamic Stock Market Data and Analysis Background
Premium
Financial data charts with glowing stock and forex graphs on a dark background illuminated in blue tones. 3D Rendering
Digital Financial Data Display with Stock Trends and Graph
Transparent Stock Market Chart Highlighting Financial Trends
Financial Data Graph Representation with Pink Overlay
Stock Market Numbers Overlay on Airplane Runway Scene
Premium
Green arrow pointing upward on financial graph. Business growth chart with rising trend line. Digital stock market data visualization for investment analysis
Dynamic Data Analysis over Virtual Grid with Neural Patterns
Global Stock Market Graphs with Virtual Data Overlays
Dynamic Hologram Interface with Stock Market Graphs and Social Media Notifications
Dynamic Stock Market Analysis with Financial Data Visualization
Premium
Stock market graph with blue technology background, financial trading analysis chart, investment growth data visualization, economic business concept
Dynamic Stocks and Trading Data Visualization
Dynamic Financial Data Display with Technology Concept
Dynamic Stock Market Graph with Data Metrics Background
Stock Market Data Visualization with Trend Lines
Premium
Hand interacting with financial stock market trading candlestick charts analyzing growth opportunities and investment strategies
Stock Market Decline with Red Graph Showing Slump in Financial Markets
Dynamic Stock Market and Technology Integration with Construction
Financial Data Display with Stock Market Graphs Analysis
Financial Analysis Overlay on Diverse Business Team in Office Meeting
Global Financial Data Network Interface Concept Visualization
Green Stock Market Trends with Financial Growth Indicators
Premium
Advanced robotic assistants working in a modern office analyzing financial data on computer screens with stock market graphs
Stock Market Index Showing Financial Data and Trends
Navigating Stock Market Trends through Digital Analytics
Dynamic Stock Market Data Visualization on Digital Screen
Digital Data Visualization with Dynamic Financial Charts and Graphs
Premium
Transparent or png stock market investment trading graph growth.Trade business analytics graph and financial chart.
Digital Stock Market Display with Growing Market Data
Stock Market Graphs Overlaying Urban Cityscape at Dusk
Global Financial Markets Data Background with Digital Graphs
Digital Financial Data Processing Over Servers
Premium
Abstract financial stock market graph with candlestick bars isolated on transparent background
Dynamic Stock Market Data and Digital Interface Concept
Global Digital Interface with Financial Data Visualization
Dynamic Stock Ticker Display Featuring Cryptocurrency Quotes
Holographic Digital Stock Market Display with Graphs
Premium
Halloween pumpkins with stock market graph in the background at night
Dynamic Financial Stock Market Display with Analytical Data
Financial Data Analysis with Digital Overlay Shows Global Trends
Financial Data with Statistics and Market Trends Overlay
Analyzing Financial Charts on Digital Screen
Premium
Magnifying glass highlights business growth chart with upward trend. Generative AI analysis financial success stock increase profit investment statistic performance market economy improvement
Stock Market Data on Digital Screen with Glowing Chart Loops
Dynamic Financial Chart Illustrating Stock Market Volatility
Vibrant Stock Market Data Display with Economic Indicators
Digital Finance Data on Cityscape Background
Premium
Stock market financial chart features blue candlesticks on a dar
Digital Stock Market Data Display with Graphs
Stock Market Indicators on Cityscape Background
Dynamic Stock Market Analytics with Data Visualization
Financial Data Platforms Globally Networked for Insights
Dynamic Digital Stock Market Ticker with Growing Graph Trends
Financial Data Visualization on Server Background
Premium
Businessman analyzing financial market data on a digital screen with a pen and stock charts in a high-tech office environment for investment and trading analysis
Stock Market Graph Overlay with Digital Interface Effects
Dynamic Stock Market Data With Digital Trading Analysis
Dynamic Stock Market Data with Fluctuating Graph
Dynamic Financial Data Display with Stock Graphs and Figures
Premium
Blue growth graph business chart data diagram on success financial presentation background
Global Data Analytics and Stock Market Visual Interface
Financial Data with Factory Setup and Conveyor Belt Concept
Dynamic Financial Stock Market Dashboard with Data Analytics
Global Stock Market Trends with Digital Graphs and Data
Premium
Growth chart business strategy up arrow graph finance stock market or increase money profit diagram on financial concept success economy investment background with digital .
Digital Financial Data Display with Graphs and Market Trends
Dynamic Digital Market Analysis with Holographic Data
Fluctuating Stock Market Display with Financial Data and Analytics
Dynamic Financial Data Display on Electronic Grid
Premium
Stock market downturn with red candlestick chart, declining line graphs, and trading data screen. Ideal for illustrating financial loss, recession, risk, and economic decline in business visuals.
Dynamic Financial Data Analyzing with Graph Overlays
Digital Stock Market Trends Display with Dynamic Graphs
Colorful Financial Data Analytics and Global Market Trends
Fluctuating Financial Stock Market with Digital Display
Premium
Professional Latina woman sits at desk in coworking office, focused on her work, looking at computer screen displaying financial charts and stock market data related to trading or financial analysis
Digital Interface Displaying Global Stock Market Data
Digital Stock Market Display with Graphs and Trends
Digital Financial Data Screen Displaying Stock Information
Stock Market Showing Declining Trend with Numbers and Graph
Premium
Upward trending financial graph with rising stock market bars and arrow
Financial Data Graph on Digital Screen Displaying Market Trends
Abstract Stock Market Data with Fluctuating Graphs
Stock Market Tickers with Dynamic Graphs on Black Background
Abstract Digital Data Chart on Computer Server Background
Financial Data Overlaid on Empty Warehouse Illustrating Market Dynamics
Financial Data Visualization in Modern Digital Display Office
Premium
Close-up of computer monitor displaying stock market graphs
Dynamic Stock Market Data on Digital Screen
Falling Stock Market Graph with Data on Black Screen
Digital Interface with Stock Data and Analytics
Dynamic Financial Graph on Digital Background
Premium
Trader checking stock market graph data on screen
Global Stock Market Trends with World Map Overlay
Colorful Stock Market Data with Infographics
Dynamic Stock Market Display Illustrating Financial Trends
Digital Display of Trading Data with Graphs and Figures
Premium
Digital glowing stock market chart with options trend and index data on a dark background, symbolizing economic growth, trading, and financial technology.
Dynamic Stock Market Display with Rising Graphs and Key Indexes
Dynamic Financial Data and Stock Market Analysis
Dynamic Display of Stock Market Data with Graph Lines
Digital Display of Stock Market Data with Rising Trends
Premium
Red and yellow financial graph descending against blue background with bokeh lights stock market trading
Financial Data Visualization on Digital Screen
Dynamic Digital Stock Market Display and Analysis
Dynamic Stock Market Ticker Display With Charts
Dynamic Chart Displaying Fluctuating Financial Data Trends
Premium
Multiple computer monitors displaying financial charts and graphs in a dimly lit office setting data
Dynamic Stock Market Tickers with Fluctuating Graphs
Fluctuating Stock Index with Confidence Building Trends
Abstract Financial Data Display with Metrics and Charts
Stock Market Volatility Display with Detailed Statistics
Premium
A businessman in a suit watches stock market data on a large monitor in a modern office while analyzing financial graphs and charts displayed.
Dynamic Stock Market Analysis with Candlestick Data Chart