- Home >
- Stock Photos >
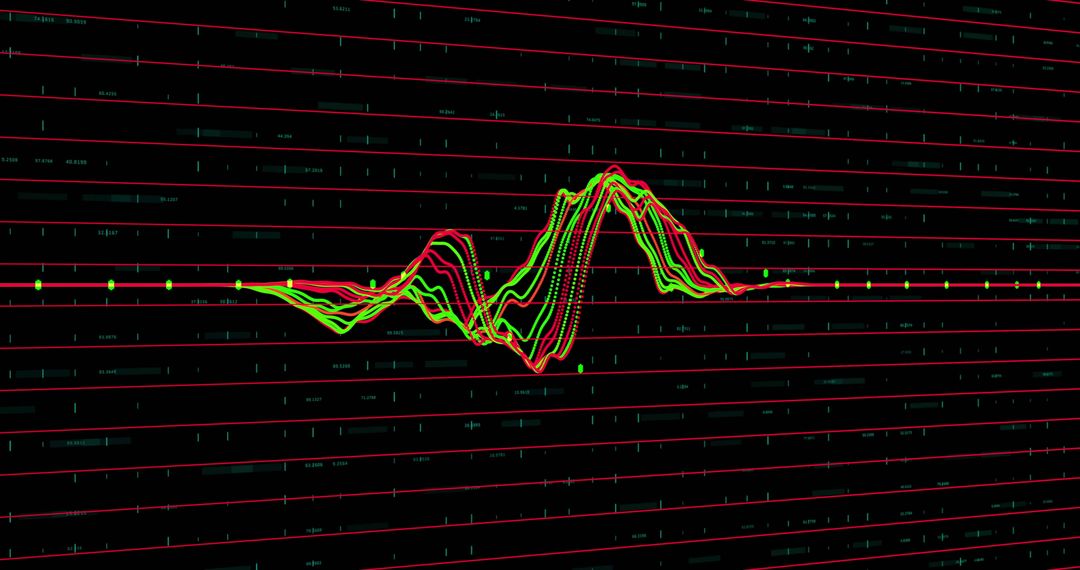
- Dynamic Stock Market Graph Display on Digital Grid
Dynamic Stock Market Graph Display on Digital Grid Image

Colorful graph lines dynamically curve upward and downward against a digital grid, symbolizing stock market fluctuations. Suitable for illustrating concepts in global finance and economic trends in reports, presentations, websites, and educational materials emphasizing market dynamics and data analysis.
Powered by  - Get 15% off with code: PIKWIZARD15


2
downloads
downloads
Tags:
More
Credit Photo
If you would like to credit the Photo, here are some ways you can do so
Text Link
photo Link
<span class="text-link">
<span>
<a target="_blank" href=https://pikwizard.com/photo/dynamic-stock-market-graph-display-on-digital-grid/ff02179c1e2e548a92cec7bf790a5bc3/>PikWizard</a>
</span>
</span>
<span class="image-link">
<span
style="margin: 0 0 20px 0; display: inline-block; vertical-align: middle; width: 100%;"
>
<a
target="_blank"
href="https://pikwizard.com/photo/dynamic-stock-market-graph-display-on-digital-grid/ff02179c1e2e548a92cec7bf790a5bc3/"
style="text-decoration: none; font-size: 10px; margin: 0;"
>
<img src="https://pikwizard.com/pw/medium/ff02179c1e2e548a92cec7bf790a5bc3.jpg" style="margin: 0; width: 100%;" alt="" />
<p style="font-size: 12px; margin: 0;">PikWizard</p>
</a>
</span>
</span>
Free (free of charge)
Free for personal and commercial use.
Author: Creative Art
Similar Free Stock Images

Premium


Premium


Premium


Premium


Premium


Premium


Premium


Premium


Premium


Premium


Premium


Premium


Premium


Premium


Premium


Premium


Premium


Premium


Premium


Premium


Premium


Premium


Premium


Premium