
- Home >
- Stock Photos >
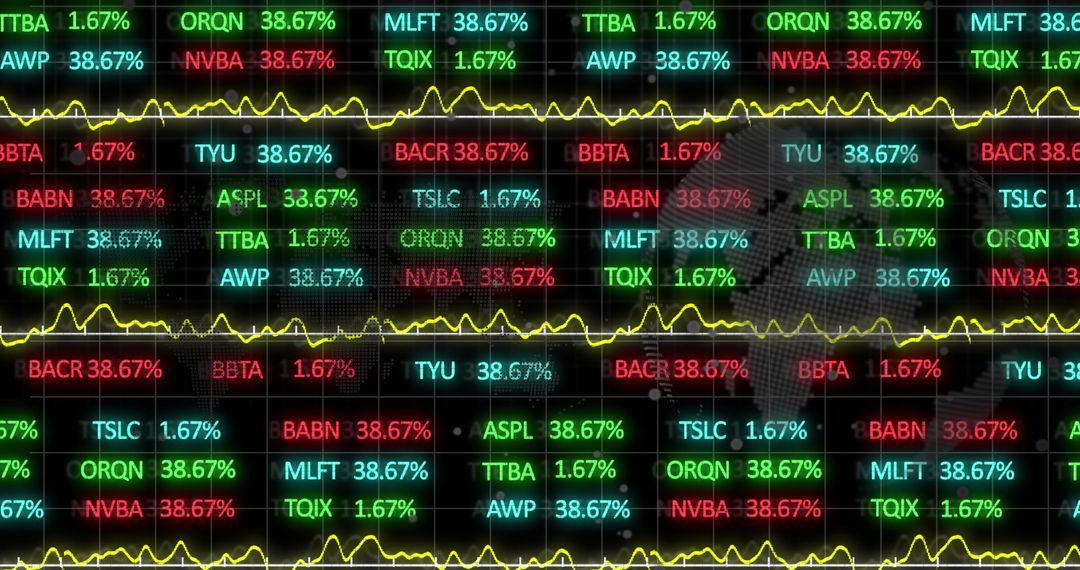
- Dynamic Stock Market Graph Displayed Over World Map Background
Dynamic Stock Market Graph Displayed Over World Map Background Image

This visual portrays the intertwining of stock market data and global business influence. With fluctuating lines symbolizing market trends and numerical data reflective of trade information, this concept highlights global finance dynamics. Ideal for use in financial articles, business presentations, and economic insights.
Powered by  - Get 15% off with code: PIKWIZARD15


4
downloads
downloads
Tags:
More
Credit Photo
If you would like to credit the Photo, here are some ways you can do so
Text Link
photo Link
<span class="text-link">
<span>
<a target="_blank" href=https://pikwizard.com/photo/dynamic-stock-market-graph-displayed-over-world-map-background/3565a8044964ac2e2ed1138880f9115d/>PikWizard</a>
</span>
</span>
<span class="image-link">
<span
style="margin: 0 0 20px 0; display: inline-block; vertical-align: middle; width: 100%;"
>
<a
target="_blank"
href="https://pikwizard.com/photo/dynamic-stock-market-graph-displayed-over-world-map-background/3565a8044964ac2e2ed1138880f9115d/"
style="text-decoration: none; font-size: 10px; margin: 0;"
>
<img src="https://pikwizard.com/pw/medium/3565a8044964ac2e2ed1138880f9115d.jpg" style="margin: 0; width: 100%;" alt="" />
<p style="font-size: 12px; margin: 0;">PikWizard</p>
</a>
</span>
</span>
Free (free of charge)
Free for personal and commercial use.
Author: Creative Art
Similar Free Stock Images

Premium


Premium


Premium


Premium


Premium


Premium


Premium


Premium


Premium


Premium


Premium


Premium


Premium


Premium


Premium


Premium


Premium


Premium


Premium


Premium


Premium


Premium


Premium


Premium

