- Home >
- Stock Photos >
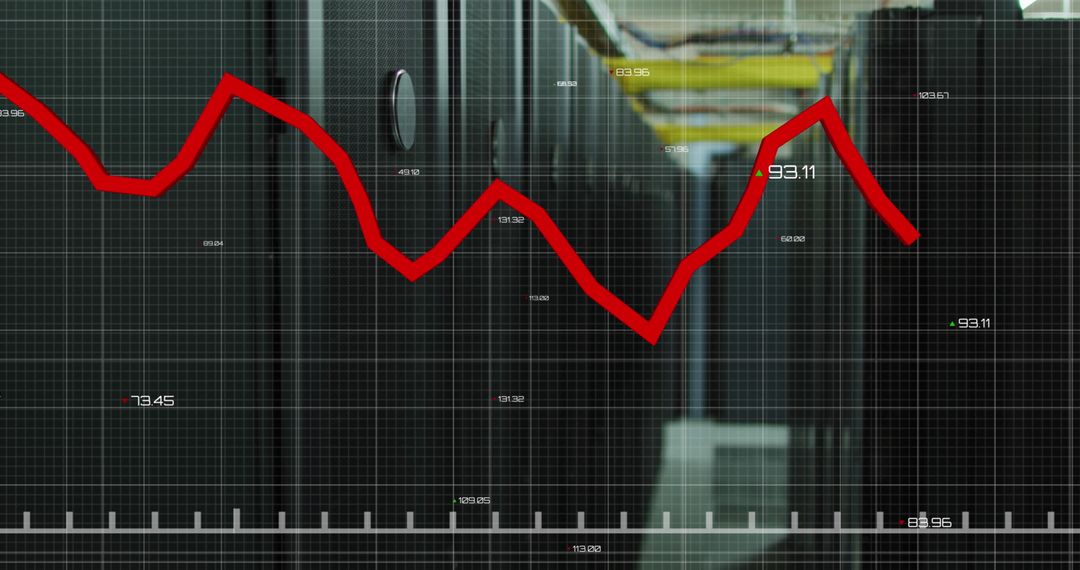
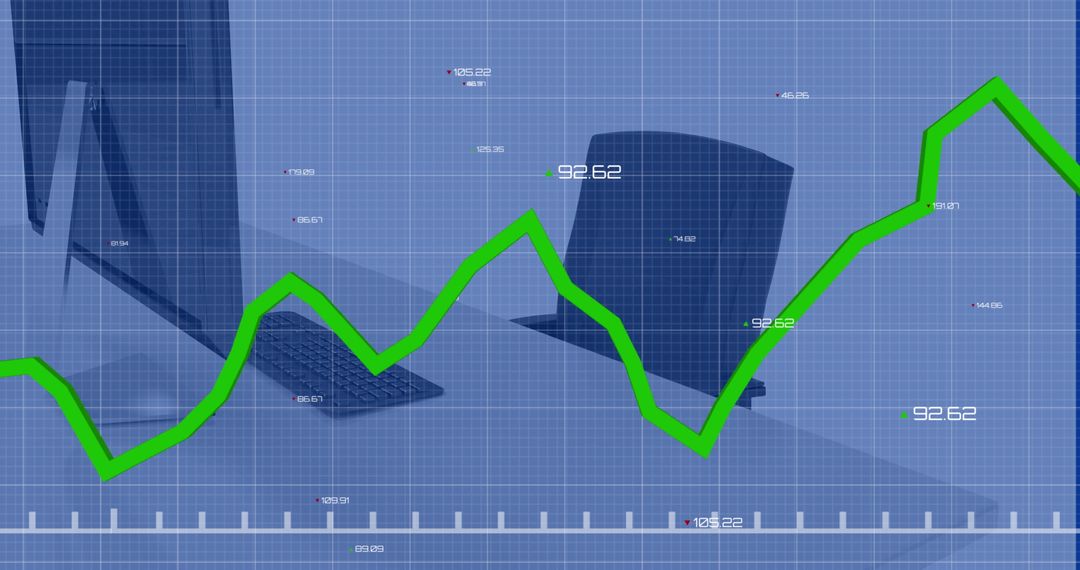
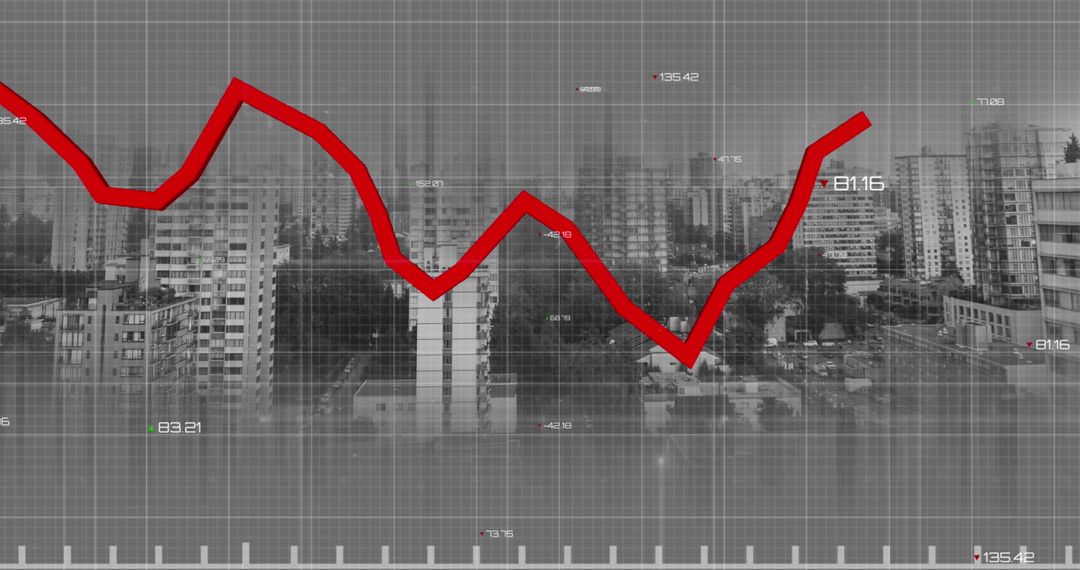
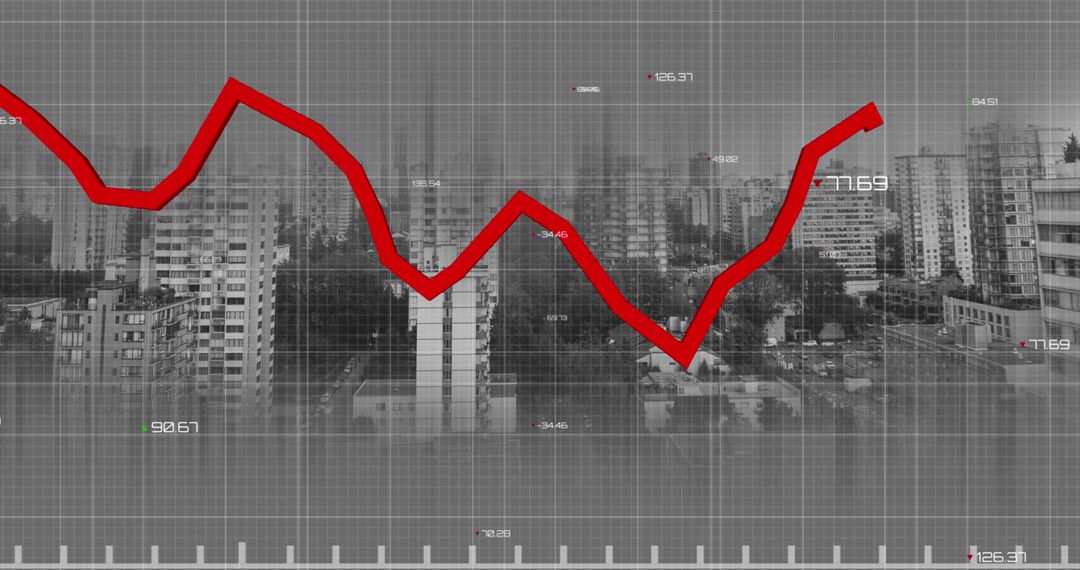
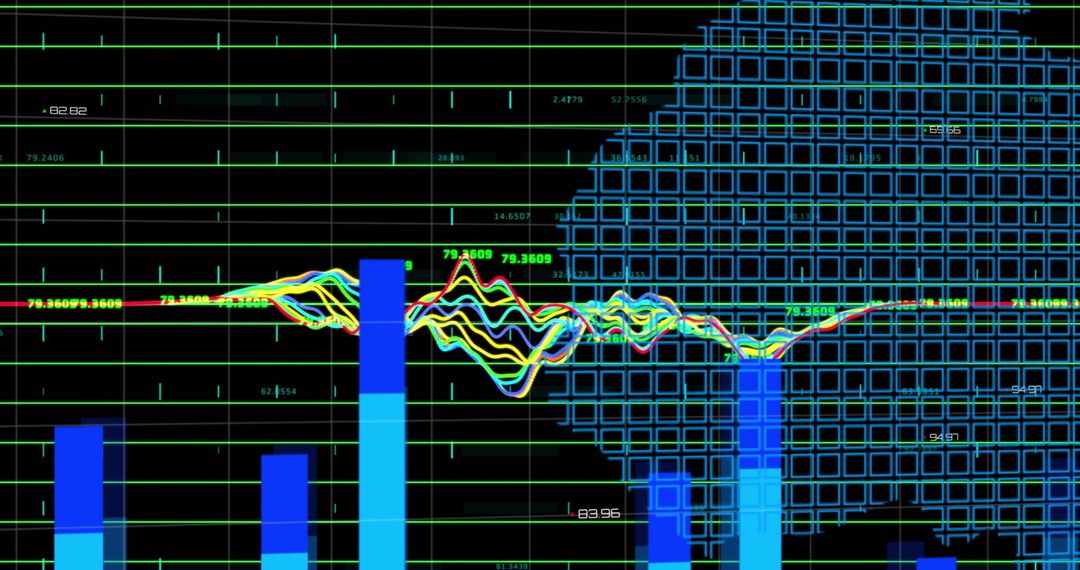
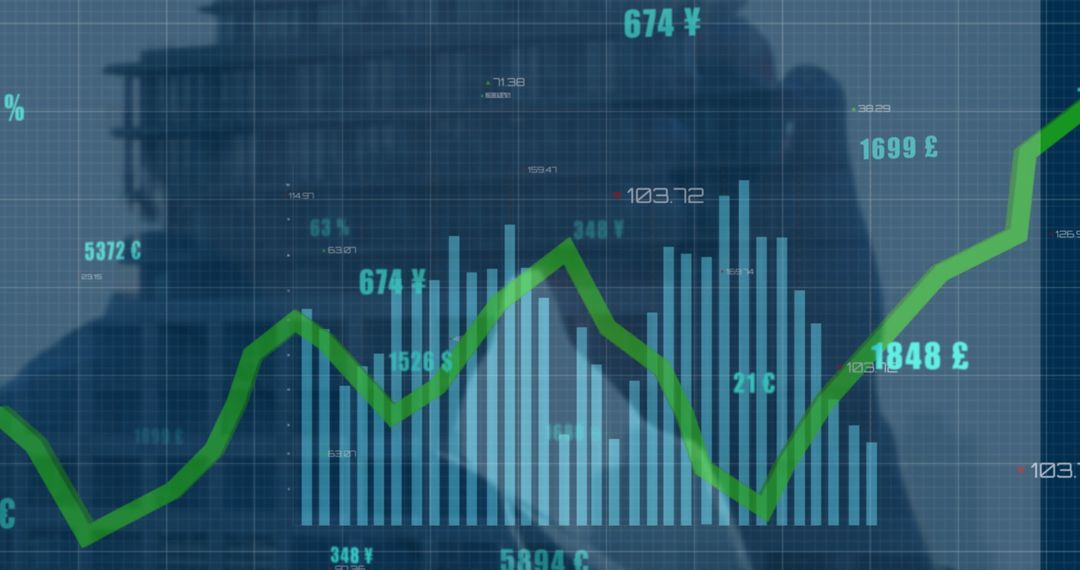
- Dynamic Stock Market Graph Fluctuating in Modern Office
Dynamic Stock Market Graph Fluctuating in Modern Office Image

Representation of financial data and stock market trends overlaying an empty and modern office environment. Useful for business presentations, financial reports, and illustrations of market variability and economic concepts.
Powered by  - Get 15% off with code: PIKWIZARD15


5
downloads
downloads
Tags:
More
Credit Photo
If you would like to credit the Photo, here are some ways you can do so
Text Link
photo Link
<span class="text-link">
<span>
<a target="_blank" href=https://pikwizard.com/photo/dynamic-stock-market-graph-fluctuating-in-modern-office/b0c97b5d0ab866fd3d51d6f4334dcfd3/>PikWizard</a>
</span>
</span>
<span class="image-link">
<span
style="margin: 0 0 20px 0; display: inline-block; vertical-align: middle; width: 100%;"
>
<a
target="_blank"
href="https://pikwizard.com/photo/dynamic-stock-market-graph-fluctuating-in-modern-office/b0c97b5d0ab866fd3d51d6f4334dcfd3/"
style="text-decoration: none; font-size: 10px; margin: 0;"
>
<img src="https://pikwizard.com/pw/medium/b0c97b5d0ab866fd3d51d6f4334dcfd3.jpg" style="margin: 0; width: 100%;" alt="" />
<p style="font-size: 12px; margin: 0;">PikWizard</p>
</a>
</span>
</span>
Free (free of charge)
Free for personal and commercial use.
Author: Creative Art
Similar Free Stock Images

Premium


Premium


Premium


Premium


Premium


Premium


Premium


Premium


Premium


Premium


Premium


Premium


Premium


Premium


Premium


Premium


Premium


Premium


Premium


Premium


Premium


Premium


Premium


Premium