
- Home >
- Stock Photos >
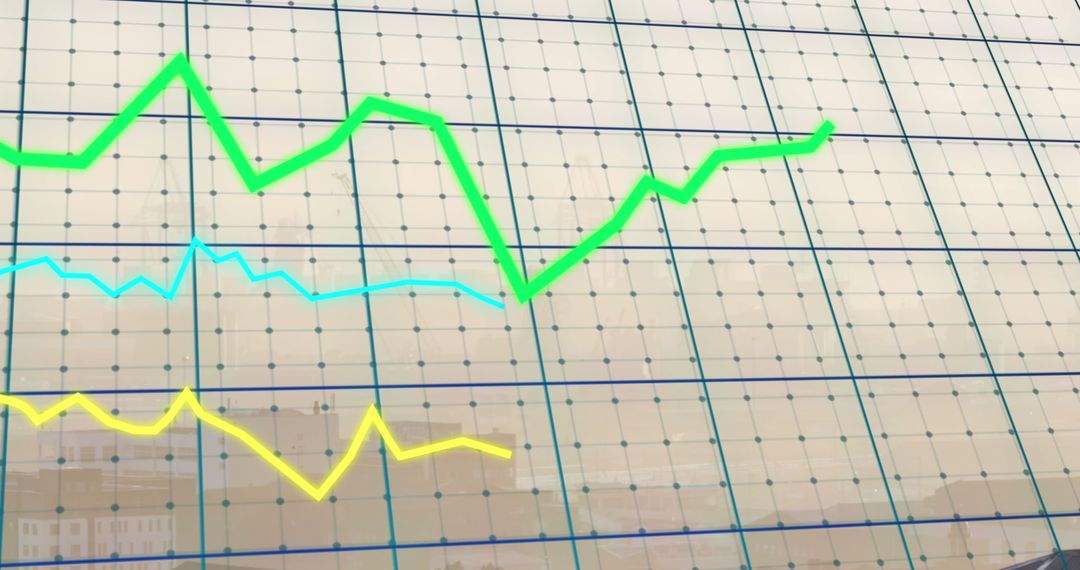
- Dynamic Stock Market Graph with Data Points and Charts
Dynamic Stock Market Graph with Data Points and Charts Image

Bright digital chart shows fluctuating financial markets, ideal for articles about stock trading strategies, economic reports, business finance education material, or presentations related sourcing.
Powered by  - Get 15% off with code: PIKWIZARD15


3
downloads
downloads
Tags:
More
Credit Photo
If you would like to credit the Photo, here are some ways you can do so
Text Link
photo Link
<span class="text-link">
<span>
<a target="_blank" href=https://pikwizard.com/photo/dynamic-stock-market-graph-with-data-points-and-charts/9f2234ce798bd9edad4a71a2ed765923/>PikWizard</a>
</span>
</span>
<span class="image-link">
<span
style="margin: 0 0 20px 0; display: inline-block; vertical-align: middle; width: 100%;"
>
<a
target="_blank"
href="https://pikwizard.com/photo/dynamic-stock-market-graph-with-data-points-and-charts/9f2234ce798bd9edad4a71a2ed765923/"
style="text-decoration: none; font-size: 10px; margin: 0;"
>
<img src="https://pikwizard.com/pw/medium/9f2234ce798bd9edad4a71a2ed765923.jpg" style="margin: 0; width: 100%;" alt="" />
<p style="font-size: 12px; margin: 0;">PikWizard</p>
</a>
</span>
</span>
Free (free of charge)
Free for personal and commercial use.
Author: Creative Art
Similar Free Stock Images

Premium


Premium


Premium


Premium


Premium


Premium


Premium


Premium


Premium


Premium


Premium


Premium


Premium


Premium


Premium


Premium


Premium


Premium


Premium


Premium


Premium


Premium


Premium


Premium

