
- Home >
- Stock Photos >
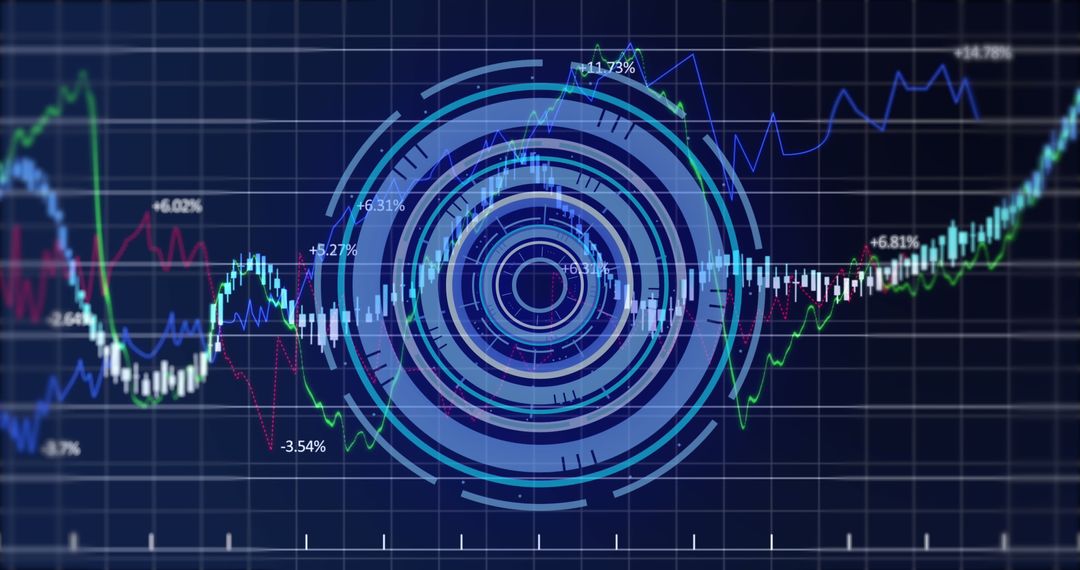
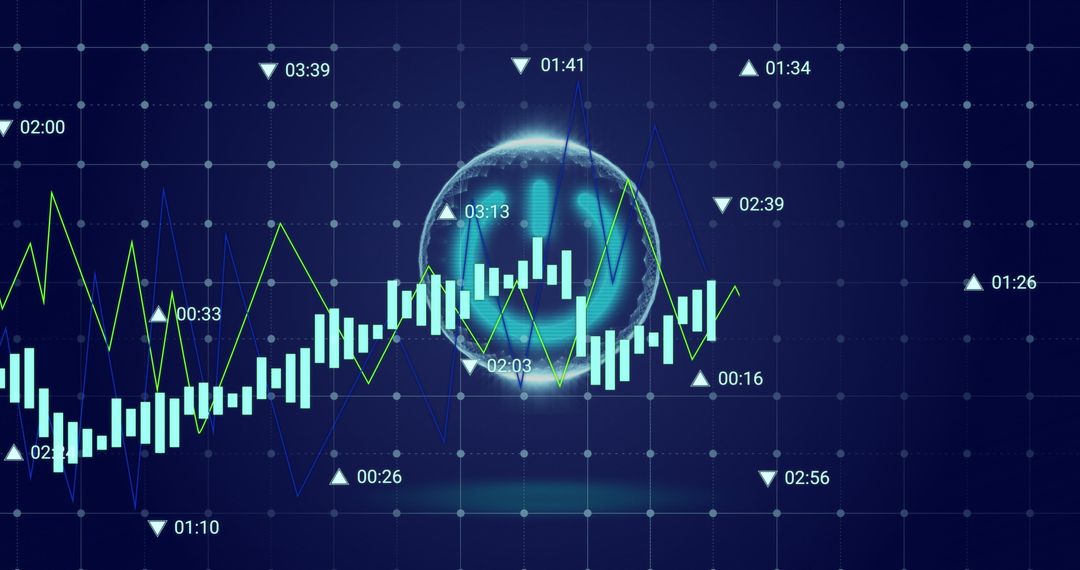
- Dynamic Stock Market Graph with Futuristic Financial Analytics
Dynamic Stock Market Graph with Futuristic Financial Analytics Image

Vivid visualization of fluctuating stock market data showing growth trends and financial analytics. Useful for finance-related blogs, investment guides, educational materials on economics, or enhancing articles discussing market forecasts.
Powered by  - Get 15% off with code: PIKWIZARD15


2
downloads
downloads
Tags:
More
Credit Photo
If you would like to credit the Photo, here are some ways you can do so
Text Link
photo Link
<span class="text-link">
<span>
<a target="_blank" href=https://pikwizard.com/photo/dynamic-stock-market-graph-with-futuristic-financial-analytics/22324f1af0ccf31cdb9ff6e0671e00d3/>PikWizard</a>
</span>
</span>
<span class="image-link">
<span
style="margin: 0 0 20px 0; display: inline-block; vertical-align: middle; width: 100%;"
>
<a
target="_blank"
href="https://pikwizard.com/photo/dynamic-stock-market-graph-with-futuristic-financial-analytics/22324f1af0ccf31cdb9ff6e0671e00d3/"
style="text-decoration: none; font-size: 10px; margin: 0;"
>
<img src="https://pikwizard.com/pw/medium/22324f1af0ccf31cdb9ff6e0671e00d3.jpg" style="margin: 0; width: 100%;" alt="" />
<p style="font-size: 12px; margin: 0;">PikWizard</p>
</a>
</span>
</span>
Free (free of charge)
Free for personal and commercial use.
Author: People Creations
Similar Free Stock Images

Premium


Premium


Premium


Premium


Premium


Premium


Premium


Premium


Premium


Premium


Premium


Premium


Premium


Premium


Premium


Premium


Premium


Premium


Premium


Premium


Premium


Premium


Premium


Premium

