- Home >
- Stock Photos >
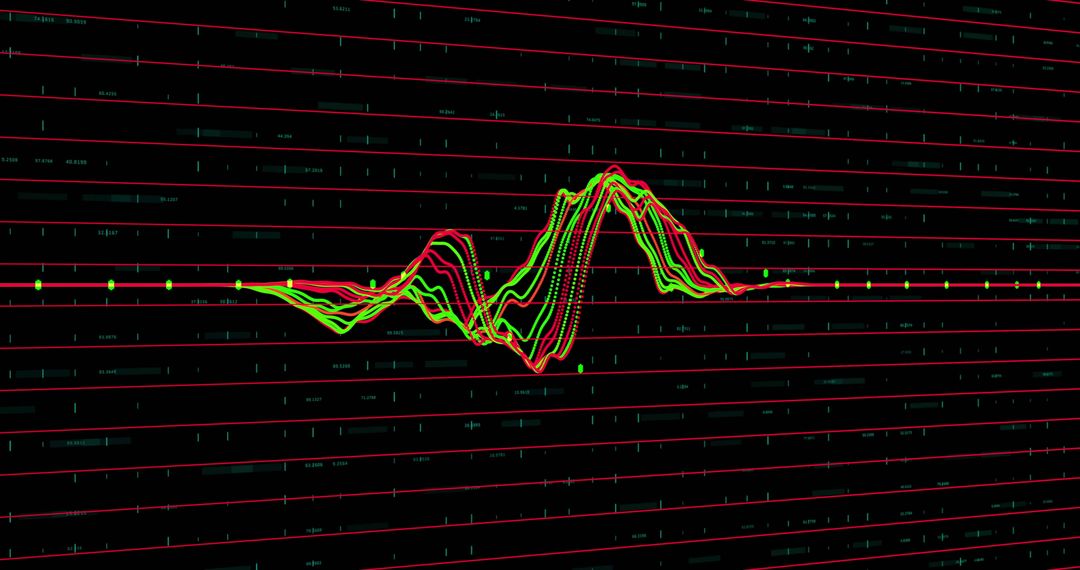
- Dynamic Stock Market Graph with Vibrant Color Lines on Grid
Dynamic Stock Market Graph with Vibrant Color Lines on Grid Image

Vibrant lines representing market fluctuations traverse a digital grid, evoking themes of global economy and financial analysis. Ideal for illustrating economic trends in blogs, financial reports, and investment articles.
Powered by 


2
downloads
downloads
Tags:
More
Credit Photo
If you would like to credit the Photo, here are some ways you can do so
Text Link
photo Link
<span class="text-link">
<span>
<a target="_blank" href=https://pikwizard.com/photo/dynamic-stock-market-graph-with-vibrant-color-lines-on-grid/30e0ed7bb419bf19ed0d8982cfccce6a/>PikWizard</a>
</span>
</span>
<span class="image-link">
<span
style="margin: 0 0 20px 0; display: inline-block; vertical-align: middle; width: 100%;"
>
<a
target="_blank"
href="https://pikwizard.com/photo/dynamic-stock-market-graph-with-vibrant-color-lines-on-grid/30e0ed7bb419bf19ed0d8982cfccce6a/"
style="text-decoration: none; font-size: 10px; margin: 0;"
>
<img src="https://pikwizard.com/pw/medium/30e0ed7bb419bf19ed0d8982cfccce6a.jpg" style="margin: 0; width: 100%;" alt="" />
<p style="font-size: 12px; margin: 0;">PikWizard</p>
</a>
</span>
</span>
Free (free of charge)
Free for personal and commercial use.
Author: Awesome Content
Similar Free Stock Images
Premium


Premium


Premium


Premium


Premium


Premium


Premium


Premium


Premium


Premium


Premium


Premium


Premium


Premium


Premium


Premium


Premium


Premium


Premium


Premium


Premium


Premium


Premium


Premium