
- Home >
- Stock Photos >
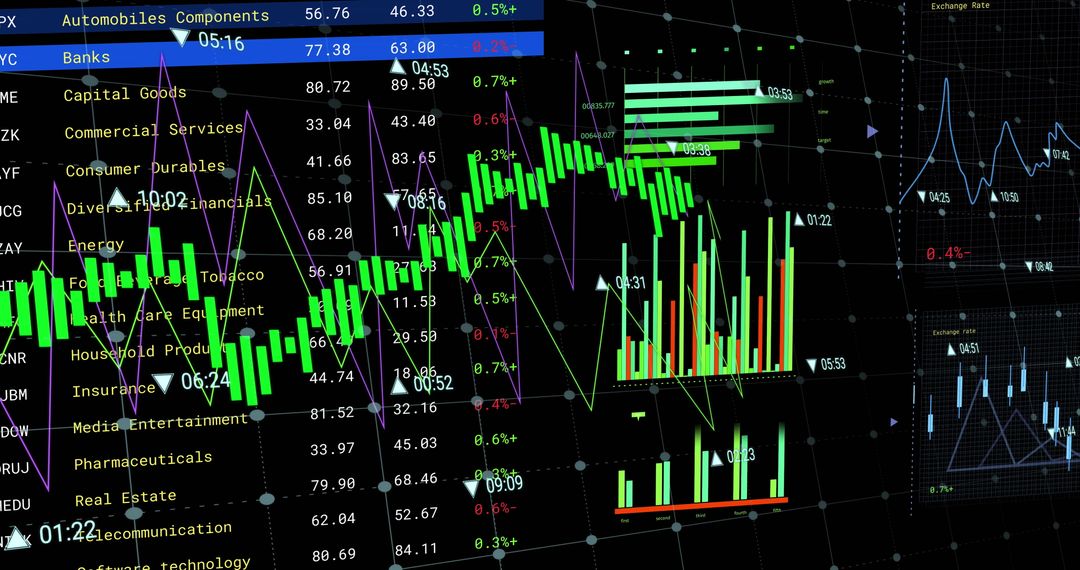
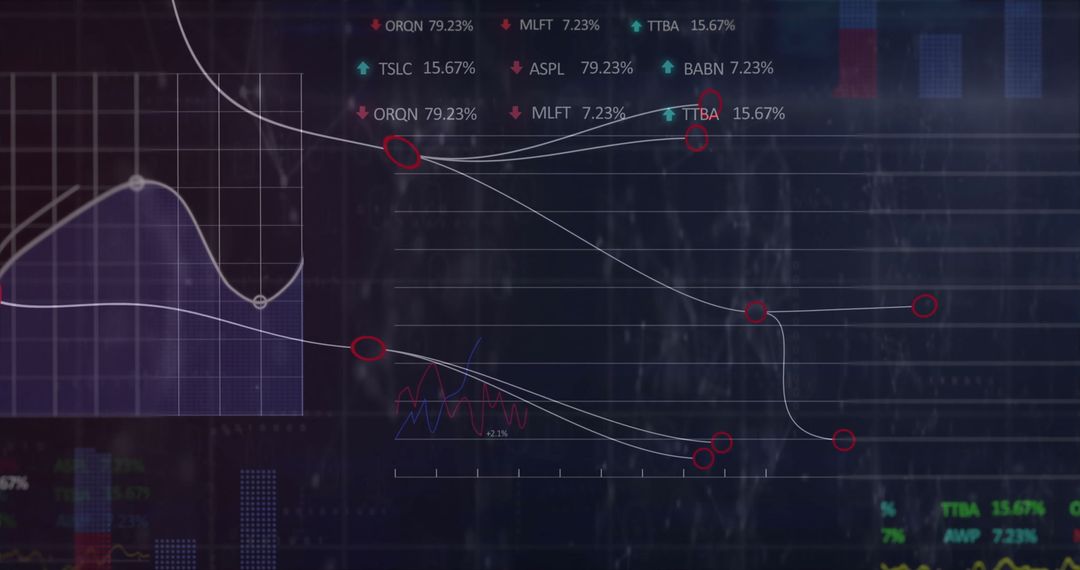
- Dynamic Stock Market Graphics on Modern Digital Interface
Dynamic Stock Market Graphics on Modern Digital Interface Image

Depicting a futuristic and tech-centric view of stock market data and analysis, this visual is ideal for illustrating financial articles, business blogs, and digital marketing materials. The focus is on trends and analytics, making it useful for education on modern trading platforms and investment strategies.
Powered by  - Get 15% off with code: PIKWIZARD15


2
downloads
downloads
Tags:
More
Credit Photo
If you would like to credit the Photo, here are some ways you can do so
Text Link
photo Link
<span class="text-link">
<span>
<a target="_blank" href=https://pikwizard.com/photo/dynamic-stock-market-graphics-on-modern-digital-interface/75e5eef3d7142f0fb06239ded6236157/>PikWizard</a>
</span>
</span>
<span class="image-link">
<span
style="margin: 0 0 20px 0; display: inline-block; vertical-align: middle; width: 100%;"
>
<a
target="_blank"
href="https://pikwizard.com/photo/dynamic-stock-market-graphics-on-modern-digital-interface/75e5eef3d7142f0fb06239ded6236157/"
style="text-decoration: none; font-size: 10px; margin: 0;"
>
<img src="https://pikwizard.com/pw/medium/75e5eef3d7142f0fb06239ded6236157.jpg" style="margin: 0; width: 100%;" alt="" />
<p style="font-size: 12px; margin: 0;">PikWizard</p>
</a>
</span>
</span>
Free (free of charge)
Free for personal and commercial use.
Author: Authentic Images
Similar Free Stock Images

Premium


Premium


Premium


Premium


Premium


Premium


Premium


Premium


Premium


Premium


Premium


Premium


Premium


Premium


Premium


Premium


Premium


Premium


Premium


Premium


Premium


Premium


Premium


Premium

