- Home >
- Stock Photos >
- Dynamic Stock Market Graphs for Trading and Investment Analysis
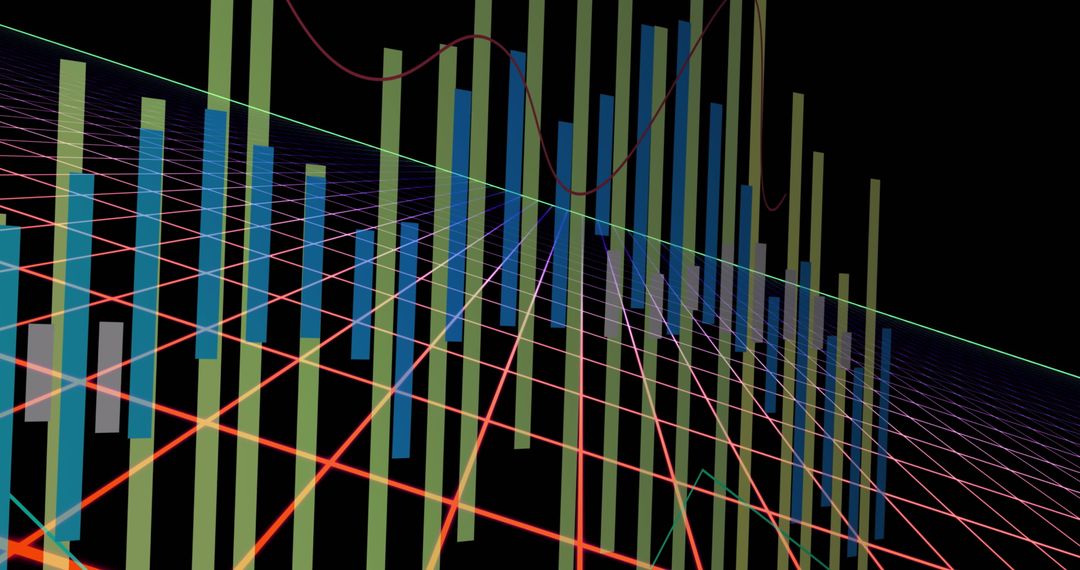
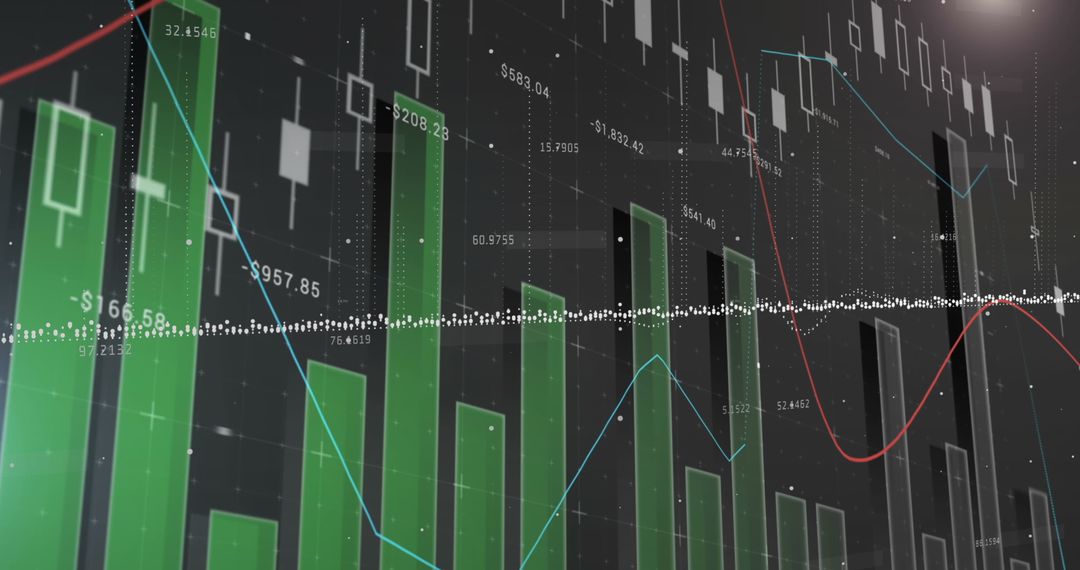
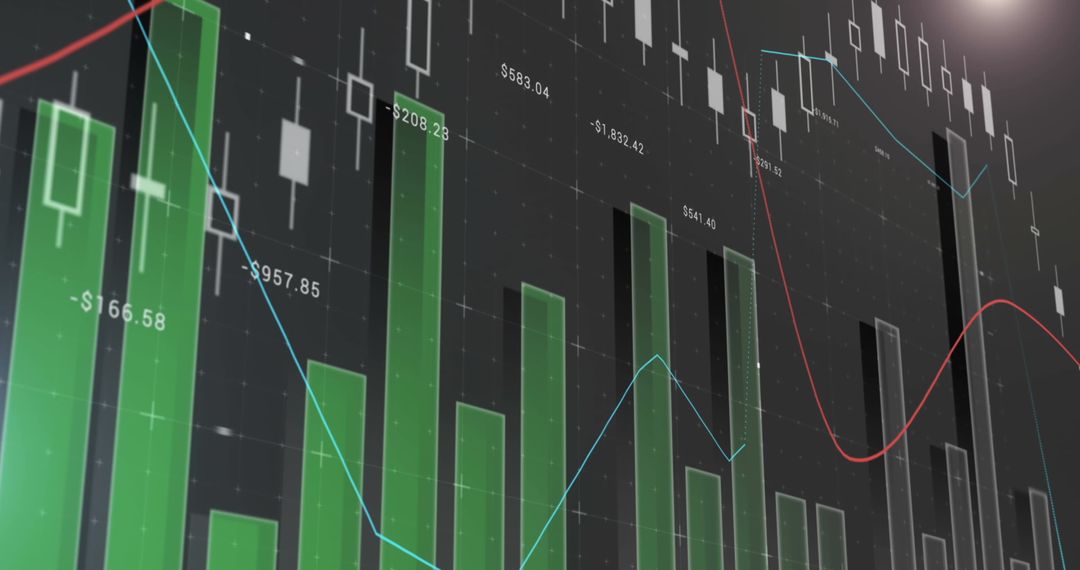
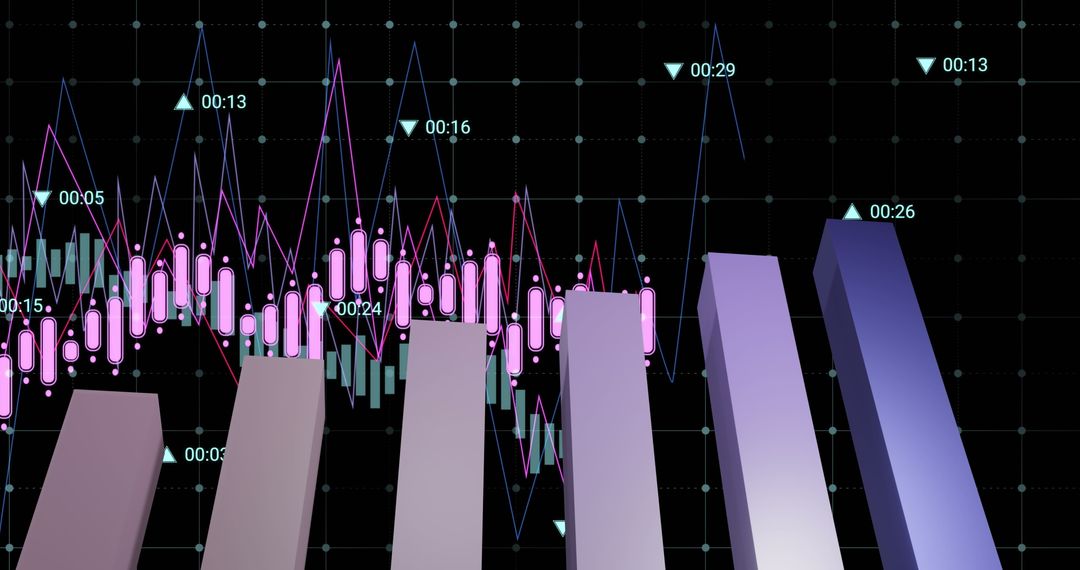
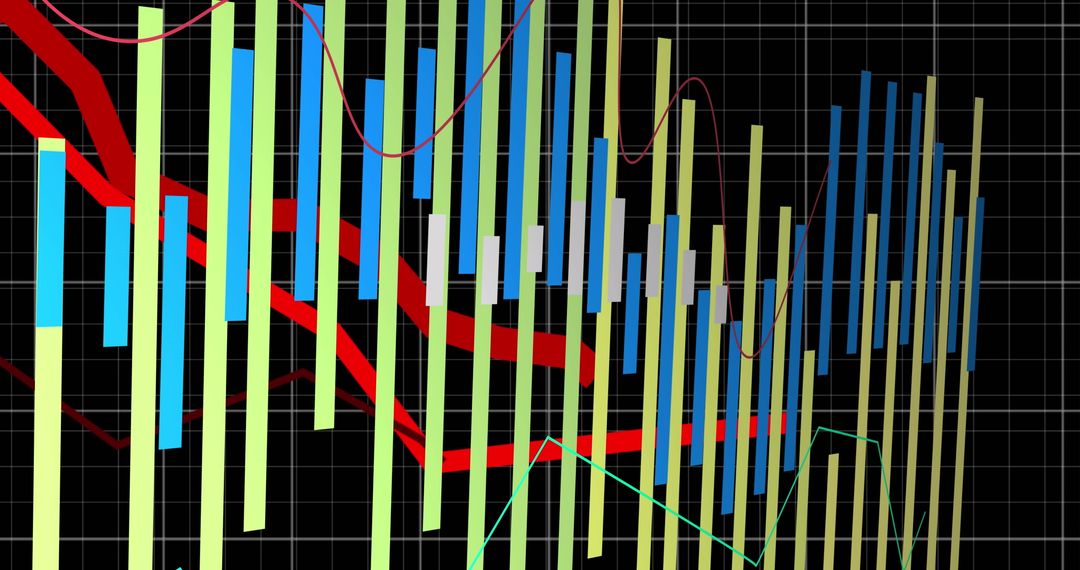
Dynamic Stock Market Graphs for Trading and Investment Analysis Image

Features modern stock market graphs with green candlesticks and red trend lines representing trading activity. Useful for illustrating financial themes, investment strategies, trading education, and market trend analysis in presentations and articles.
Powered by 


15
downloads
downloads
Tags:
More
Credit Photo
If you would like to credit the Photo, here are some ways you can do so
Text Link
photo Link
<span class="text-link">
<span>
<a target="_blank" href=https://pikwizard.com/photo/dynamic-stock-market-graphs-for-trading-and-investment-analysis/7e9bf99f12d7e4352c5bf2d5b1c0c21c/>PikWizard</a>
</span>
</span>
<span class="image-link">
<span
style="margin: 0 0 20px 0; display: inline-block; vertical-align: middle; width: 100%;"
>
<a
target="_blank"
href="https://pikwizard.com/photo/dynamic-stock-market-graphs-for-trading-and-investment-analysis/7e9bf99f12d7e4352c5bf2d5b1c0c21c/"
style="text-decoration: none; font-size: 10px; margin: 0;"
>
<img src="https://pikwizard.com/pw/medium/7e9bf99f12d7e4352c5bf2d5b1c0c21c.jpg" style="margin: 0; width: 100%;" alt="" />
<p style="font-size: 12px; margin: 0;">PikWizard</p>
</a>
</span>
</span>
Free (free of charge)
Free for personal and commercial use.
Author: Creative Art
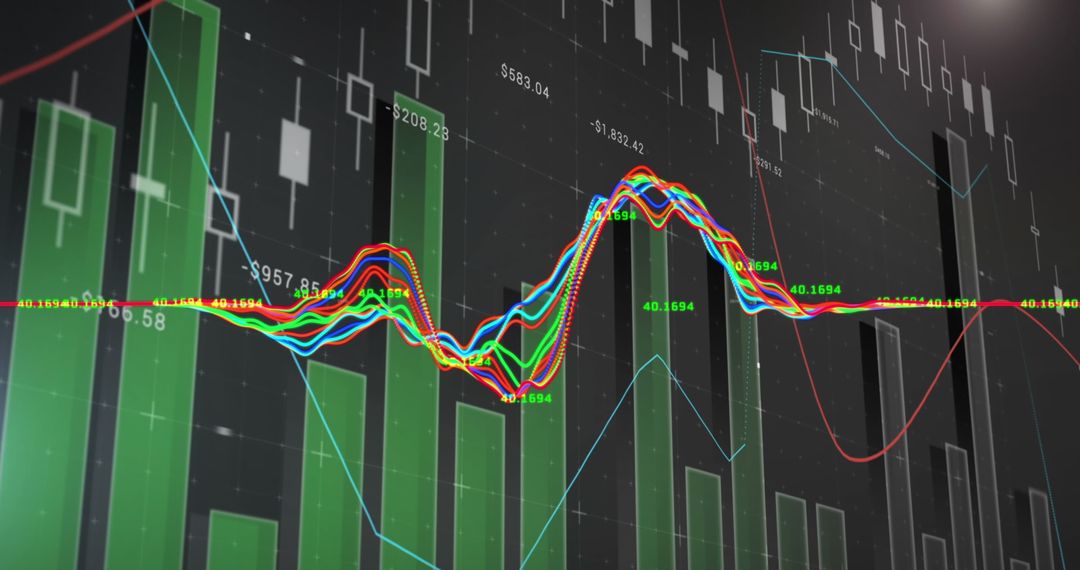
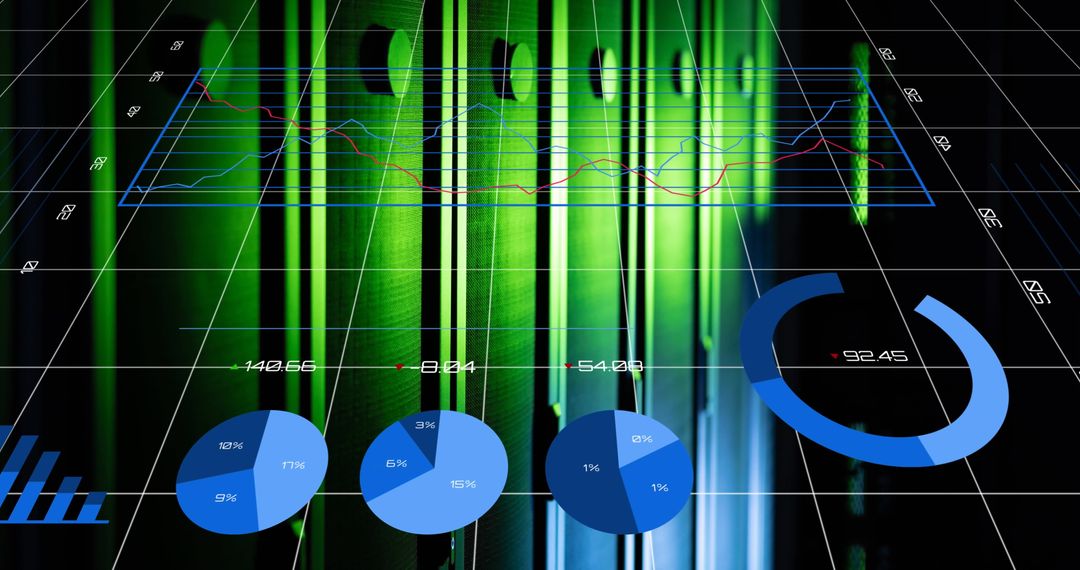
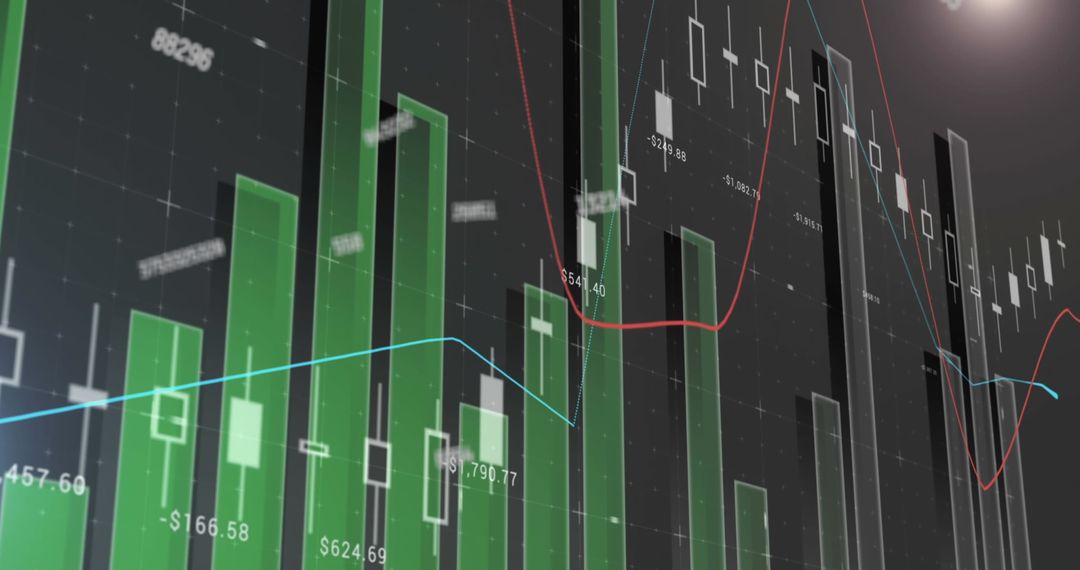
Similar Free Stock Images

Premium


Premium


Premium


Premium


Premium


Premium


Premium


Premium


Premium


Premium


Premium


Premium


Premium


Premium


Premium


Premium


Premium


Premium


Premium


Premium


Premium


Premium


Premium


Premium