
- Home >
- Stock Photos >
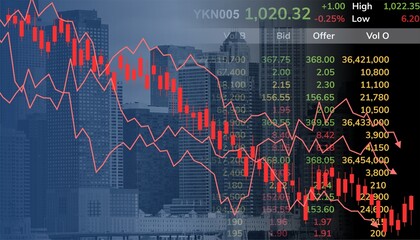
- Dynamic Stock Market Graphs Show Financial Analytics and Trends
Dynamic Stock Market Graphs Show Financial Analytics and Trends Image

Graphic combines various financial graphs and charts, showcasing complex data and trends pivotal in stock market analysis. Frequently used in finance-related contexts for presentations, economic reports, market analysis articles, investment strategies, highlights on websites, magazines, blogs dedicated towards education in finance, or illustrating points about economic fluctuations.
Powered by 


2
downloads
downloads
Tags:
More
Credit Photo
If you would like to credit the Photo, here are some ways you can do so
Text Link
photo Link
<span class="text-link">
<span>
<a target="_blank" href=https://pikwizard.com/photo/dynamic-stock-market-graphs-show-financial-analytics-and-trends/23844f59a1582f7ab3d7d5c805b5a8a5/>PikWizard</a>
</span>
</span>
<span class="image-link">
<span
style="margin: 0 0 20px 0; display: inline-block; vertical-align: middle; width: 100%;"
>
<a
target="_blank"
href="https://pikwizard.com/photo/dynamic-stock-market-graphs-show-financial-analytics-and-trends/23844f59a1582f7ab3d7d5c805b5a8a5/"
style="text-decoration: none; font-size: 10px; margin: 0;"
>
<img src="https://pikwizard.com/pw/medium/23844f59a1582f7ab3d7d5c805b5a8a5.jpg" style="margin: 0; width: 100%;" alt="" />
<p style="font-size: 12px; margin: 0;">PikWizard</p>
</a>
</span>
</span>
Free (free of charge)
Free for personal and commercial use.
Author: Awesome Content
Similar Free Stock Images
Loading...

Premium


Premium


Premium


Premium


Premium


Premium


Premium


Premium

Premium


Premium


Premium


Premium


Premium


Premium


Premium

Premium


Premium

Premium


Premium


Premium
Premium

Premium


Premium

Premium


Premium

