- Home >
- Stock Photos >
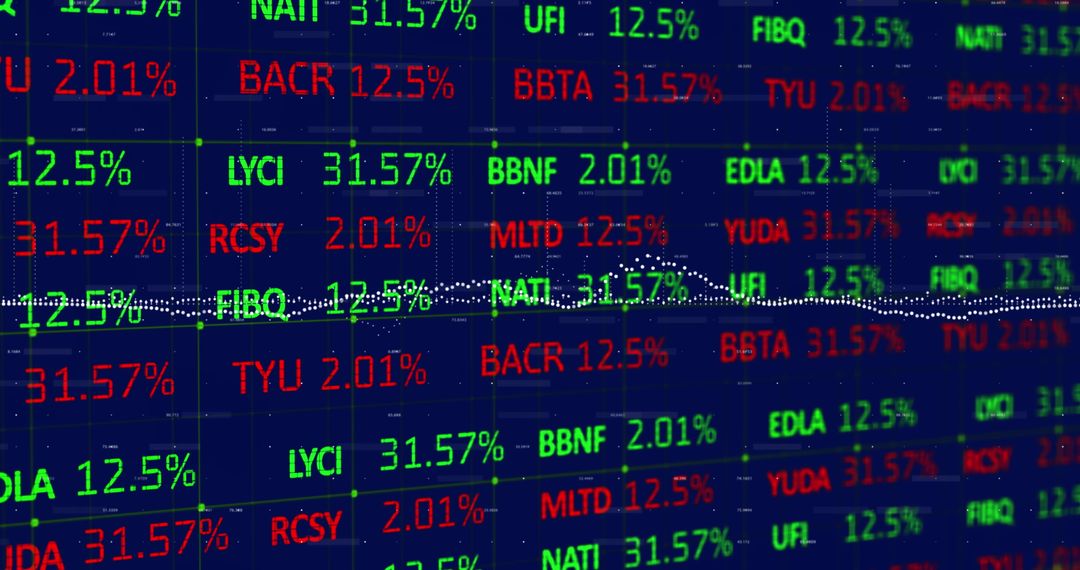
- Dynamic Stock Market Graphs with Green and Red Digits
Dynamic Stock Market Graphs with Green and Red Digits Image

Ideal for illustrating articles related to finance, investments, or economic analysis. Use in presentations about market trends, trading strategies, or data science applications. Provides a visual representation of market volatility or trading activity.
Powered by  - Get 15% off with code: PIKWIZARD15


2
downloads
downloads
Tags:
More
Credit Photo
If you would like to credit the Photo, here are some ways you can do so
Text Link
photo Link
<span class="text-link">
<span>
<a target="_blank" href=https://pikwizard.com/photo/dynamic-stock-market-graphs-with-green-and-red-digits/fa99ce766a3224858aa6ffe1bb553d84/>PikWizard</a>
</span>
</span>
<span class="image-link">
<span
style="margin: 0 0 20px 0; display: inline-block; vertical-align: middle; width: 100%;"
>
<a
target="_blank"
href="https://pikwizard.com/photo/dynamic-stock-market-graphs-with-green-and-red-digits/fa99ce766a3224858aa6ffe1bb553d84/"
style="text-decoration: none; font-size: 10px; margin: 0;"
>
<img src="https://pikwizard.com/pw/medium/fa99ce766a3224858aa6ffe1bb553d84.jpg" style="margin: 0; width: 100%;" alt="" />
<p style="font-size: 12px; margin: 0;">PikWizard</p>
</a>
</span>
</span>
Free (free of charge)
Free for personal and commercial use.
Author: Creative Art
Similar Free Stock Images

Premium


Premium


Premium


Premium


Premium


Premium


Premium


Premium


Premium


Premium


Premium


Premium


Premium


Premium


Premium


Premium


Premium


Premium


Premium


Premium


Premium


Premium


Premium


Premium