- Home >
- Stock Photos >
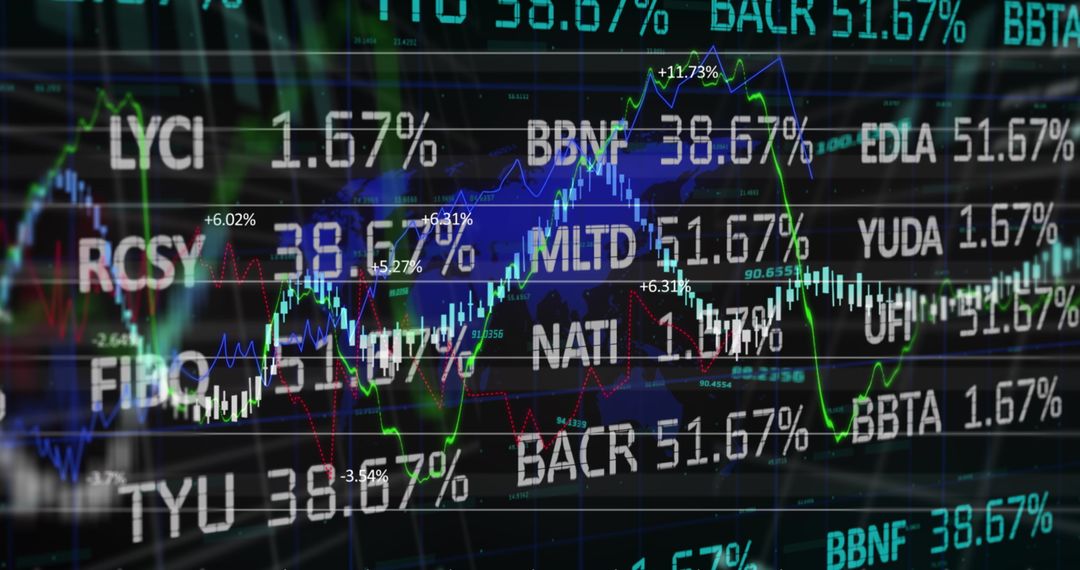
- Dynamic Stock Market Ticker Display with Rising and Falling Graphs
Dynamic Stock Market Ticker Display with Rising and Falling Graphs Image

Presentation of animated stock market tickers and graphs in vibrant colors over dark background. Ideal for illustrating concepts in finance, business reports, stock exchange environments or promotional materials. Useful for depicting fluctuations in stock prices and financial market trends.
Powered by  - Get 15% off with code: PIKWIZARD15


2
downloads
downloads
Tags:
More
Credit Photo
If you would like to credit the Photo, here are some ways you can do so
Text Link
photo Link
<span class="text-link">
<span>
<a target="_blank" href=https://pikwizard.com/photo/dynamic-stock-market-ticker-display-with-rising-and-falling-graphs/f8110312d964c9f01fe4d415a9535617/>PikWizard</a>
</span>
</span>
<span class="image-link">
<span
style="margin: 0 0 20px 0; display: inline-block; vertical-align: middle; width: 100%;"
>
<a
target="_blank"
href="https://pikwizard.com/photo/dynamic-stock-market-ticker-display-with-rising-and-falling-graphs/f8110312d964c9f01fe4d415a9535617/"
style="text-decoration: none; font-size: 10px; margin: 0;"
>
<img src="https://pikwizard.com/pw/medium/f8110312d964c9f01fe4d415a9535617.jpg" style="margin: 0; width: 100%;" alt="" />
<p style="font-size: 12px; margin: 0;">PikWizard</p>
</a>
</span>
</span>
Free (free of charge)
Free for personal and commercial use.
Author: Awesome Content
Similar Free Stock Images

Premium


Premium


Premium


Premium


Premium


Premium


Premium


Premium


Premium


Premium


Premium


Premium


Premium


Premium


Premium


Premium


Premium


Premium


Premium


Premium


Premium


Premium


Premium


Premium