
- Home >
- Stock Photos >
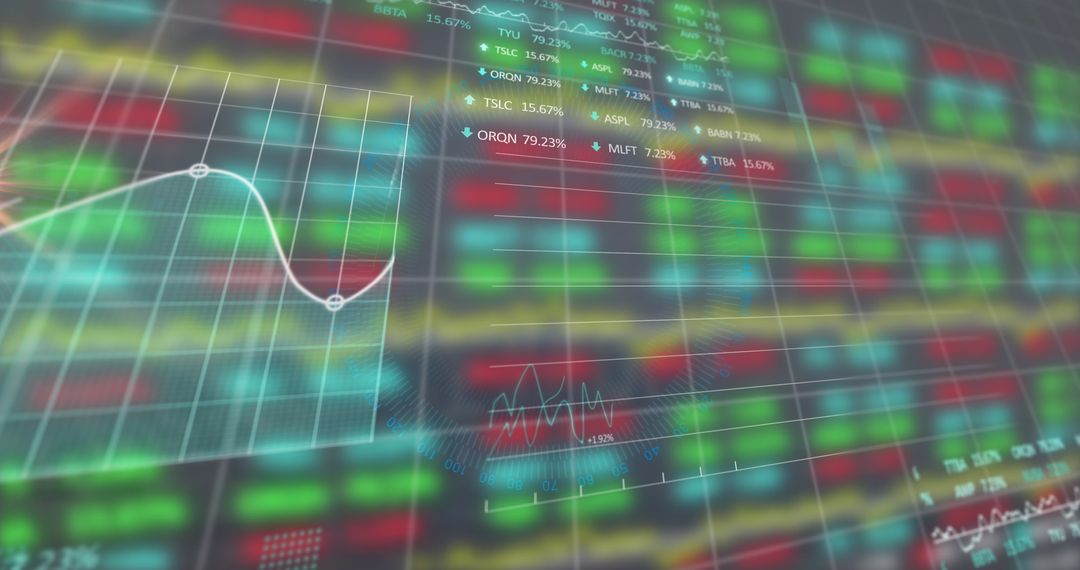
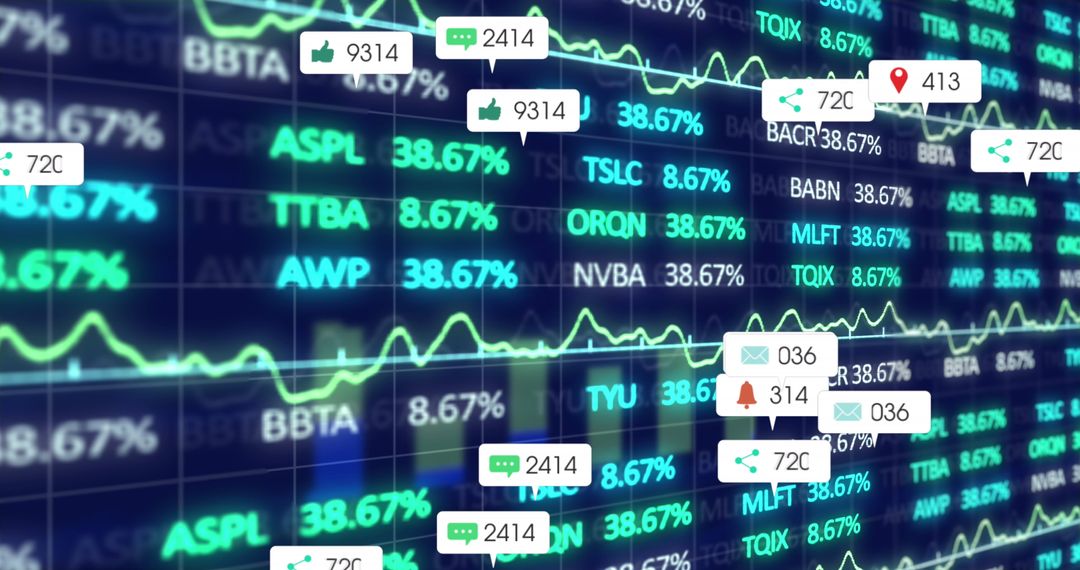
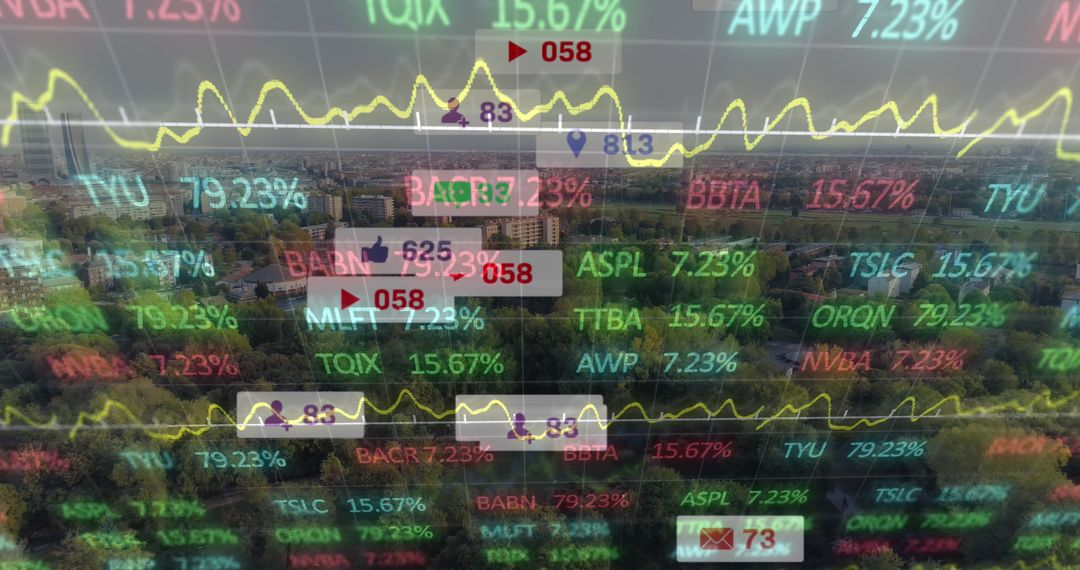
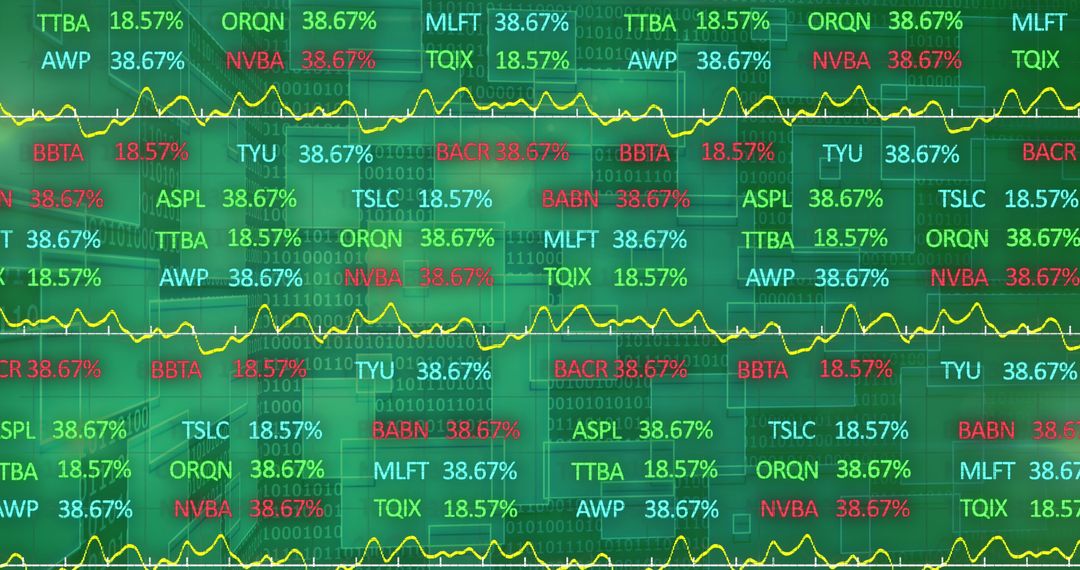
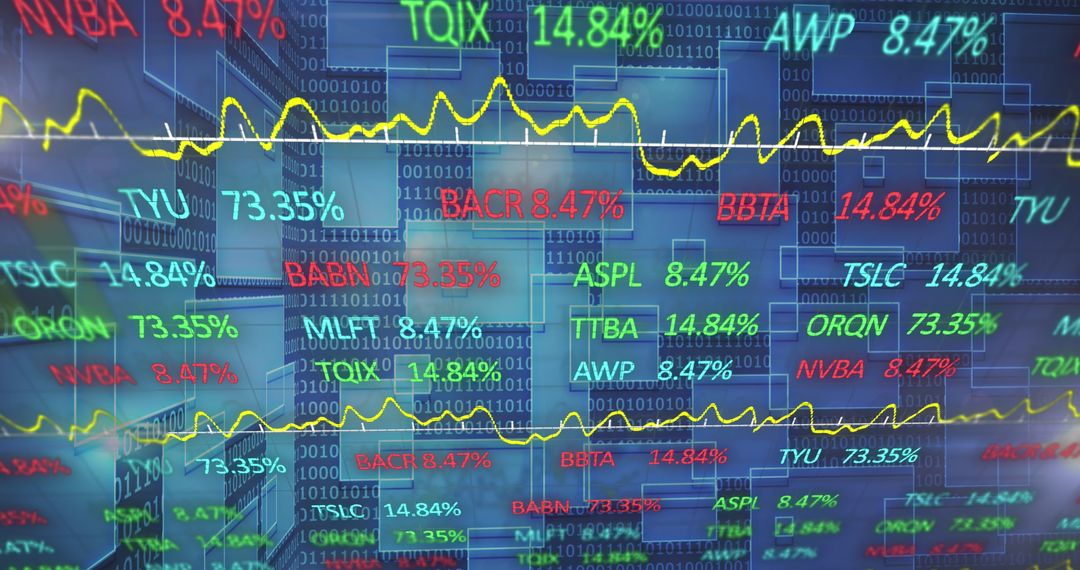
- Dynamic Stock Market Tickers and Data Trends in Digital Interface
Dynamic Stock Market Tickers and Data Trends in Digital Interface Image

Visual symbolizes the dynamic movement of financial markets with indicators of stock trading through digital display. Useful for illustrations regarding contemporary business analyses, financial reports, and adapting to the rapidly changing investor landscape racquets. Fit for technology themes highlighting economic insights or as an educational aid in investment strategies.
Powered by  - Get 15% off with code: PIKWIZARD15


2
downloads
downloads
Tags:
More
Credit Photo
If you would like to credit the Photo, here are some ways you can do so
Text Link
photo Link
<span class="text-link">
<span>
<a target="_blank" href=https://pikwizard.com/photo/dynamic-stock-market-tickers-and-data-trends-in-digital-interface/040bd2a50824710a6b19fecec4d86a71/>PikWizard</a>
</span>
</span>
<span class="image-link">
<span
style="margin: 0 0 20px 0; display: inline-block; vertical-align: middle; width: 100%;"
>
<a
target="_blank"
href="https://pikwizard.com/photo/dynamic-stock-market-tickers-and-data-trends-in-digital-interface/040bd2a50824710a6b19fecec4d86a71/"
style="text-decoration: none; font-size: 10px; margin: 0;"
>
<img src="https://pikwizard.com/pw/medium/040bd2a50824710a6b19fecec4d86a71.jpg" style="margin: 0; width: 100%;" alt="" />
<p style="font-size: 12px; margin: 0;">PikWizard</p>
</a>
</span>
</span>
Free (free of charge)
Free for personal and commercial use.
Author: Authentic Images
Similar Free Stock Images

Premium


Premium


Premium


Premium


Premium


Premium


Premium


Premium


Premium


Premium


Premium


Premium


Premium


Premium


Premium


Premium


Premium


Premium


Premium


Premium


Premium


Premium


Premium


Premium

