- Home >
- Stock Photos >
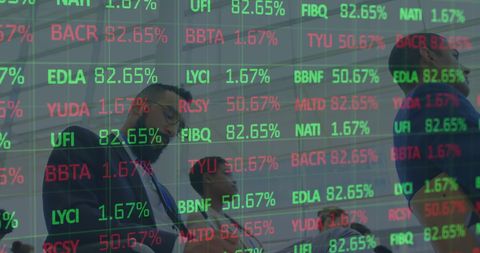
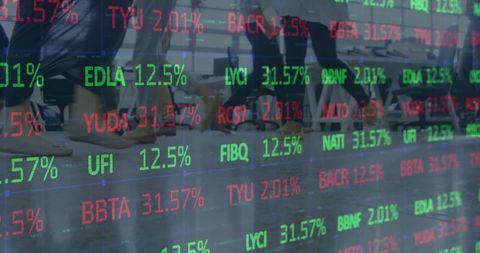
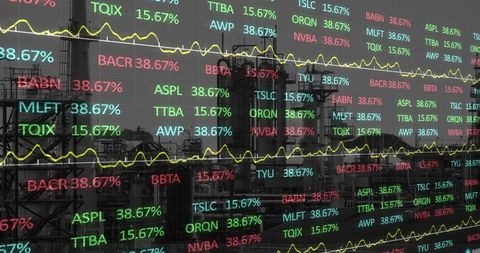
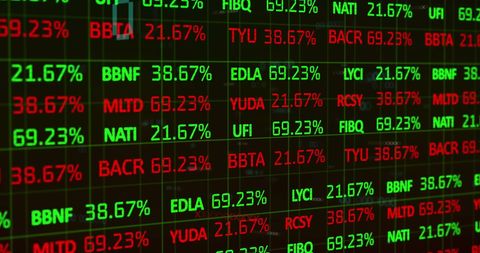
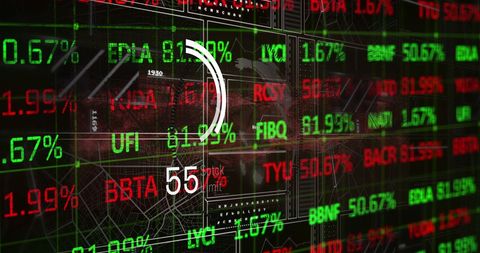
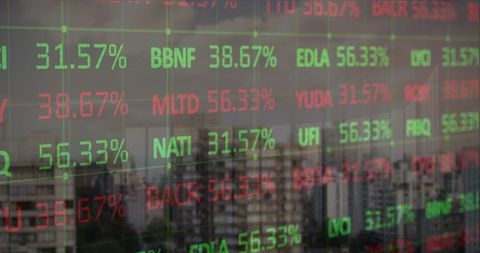
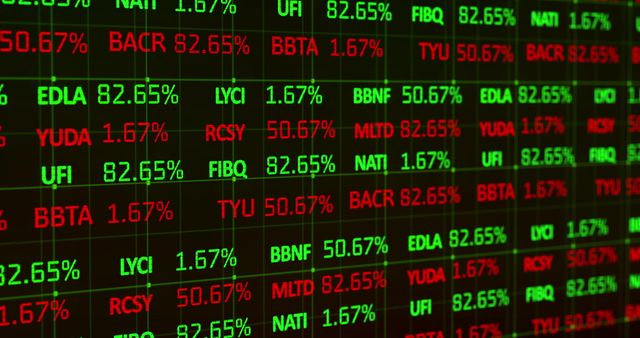
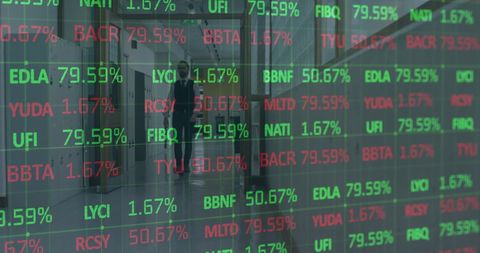
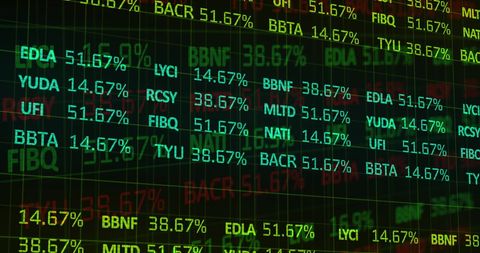
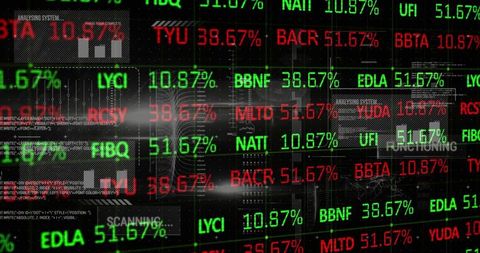
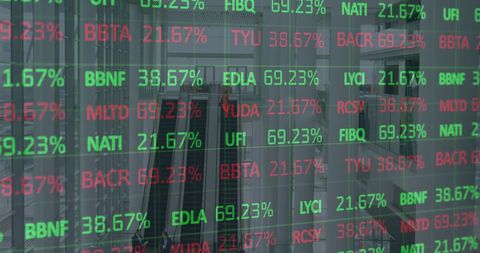
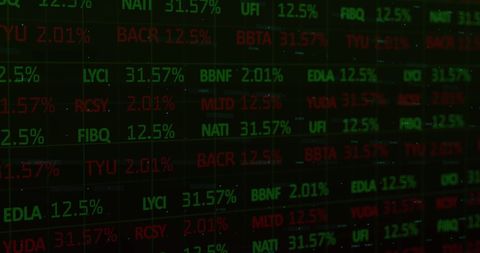
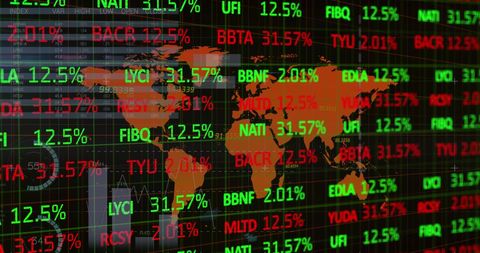
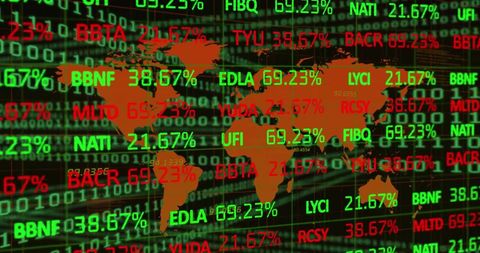
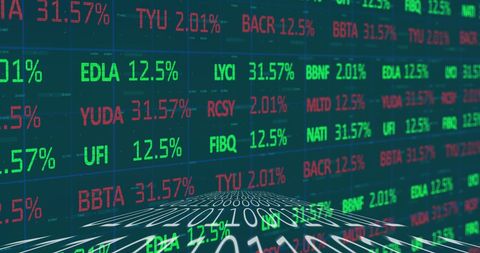
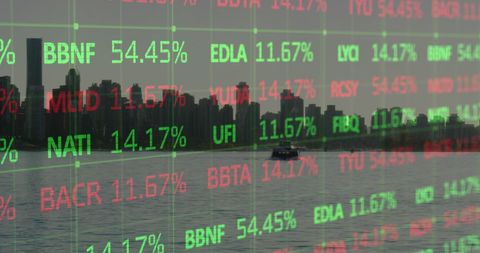
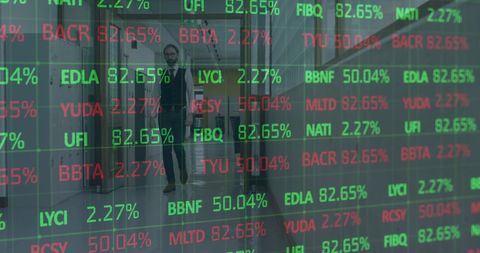
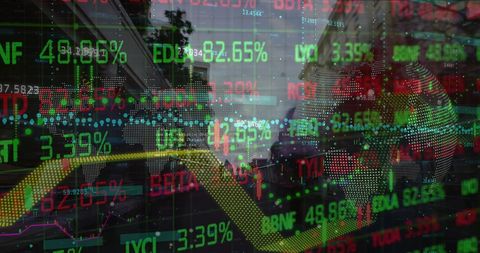
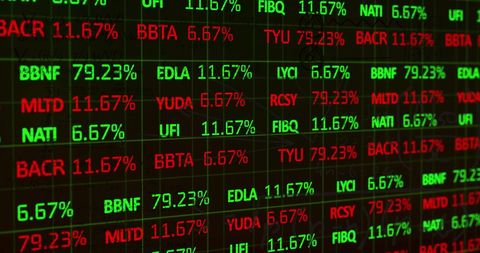
- Dynamic Stock Market Tickers over Night Cityscape
Dynamic Stock Market Tickers over Night Cityscape Image
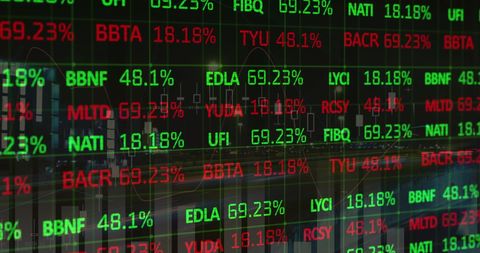
Visual blend of stock market tickers with glowing lights of urban night cityscape symbolizes synergy in global finance and business analytics. Use for materials related to financial services, stock trading webinars or economic analysis presentations.
Powered by 


2
downloads
downloads
Tags:
More
Credit Photo
If you would like to credit the Photo, here are some ways you can do so
Text Link
photo Link
<span class="text-link">
<span>
<a target="_blank" href=https://pikwizard.com/photo/dynamic-stock-market-tickers-over-night-cityscape/fd771143b079d2e827548faa0b4fcb5b/>PikWizard</a>
</span>
</span>
<span class="image-link">
<span
style="margin: 0 0 20px 0; display: inline-block; vertical-align: middle; width: 100%;"
>
<a
target="_blank"
href="https://pikwizard.com/photo/dynamic-stock-market-tickers-over-night-cityscape/fd771143b079d2e827548faa0b4fcb5b/"
style="text-decoration: none; font-size: 10px; margin: 0;"
>
<img src="https://pikwizard.com/pw/medium/fd771143b079d2e827548faa0b4fcb5b.jpg" style="margin: 0; width: 100%;" alt="" />
<p style="font-size: 12px; margin: 0;">PikWizard</p>
</a>
</span>
</span>
Free (free of charge)
Free for personal and commercial use.
Author: People Creations
Similar Free Stock Images
Loading...
Premium


Premium


Premium


Premium

Premium


Premium


Premium


Premium

Premium


Premium


Premium


Premium


Premium


Premium

Premium

Premium


Premium


Premium


Premium


Premium


Premium


Premium


Premium


Premium

Premium