- Home >
- Stock Photos >
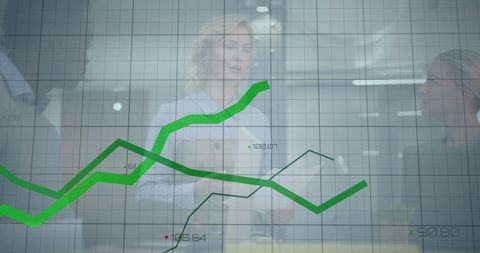
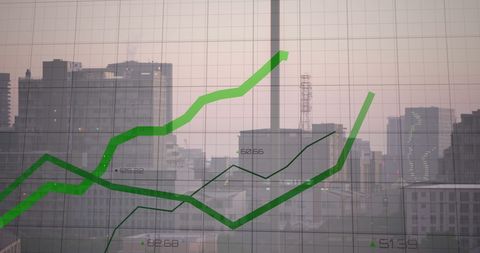
- Dynamic Stock Market Trends and Data Visualization
Dynamic Stock Market Trends and Data Visualization Image

Green lines trending upwards on financial graph depicts stock market analysis and economic growth. Utilized for illustrating financial growth, business reports, presentations, and discussions on economic trends.

downloads
Tags:
More
Credit Photo
If you would like to credit the Photo, here are some ways you can do so
Text Link
photo Link
<span class="text-link">
<span>
<a target="_blank" href=https://pikwizard.com/photo/dynamic-stock-market-trends-and-data-visualization/055692ae4fa913f763cf2141bf1f6ca7/>PikWizard</a>
</span>
</span>
<span class="image-link">
<span
style="margin: 0 0 20px 0; display: inline-block; vertical-align: middle; width: 100%;"
>
<a
target="_blank"
href="https://pikwizard.com/photo/dynamic-stock-market-trends-and-data-visualization/055692ae4fa913f763cf2141bf1f6ca7/"
style="text-decoration: none; font-size: 10px; margin: 0;"
>
<img src="https://pikwizard.com/pw/medium/055692ae4fa913f763cf2141bf1f6ca7.jpg" style="margin: 0; width: 100%;" alt="" />
<p style="font-size: 12px; margin: 0;">PikWizard</p>
</a>
</span>
</span>
Free (free of charge)
Free for personal and commercial use.
Author: People Creations