- Home >
- Stock Photos >
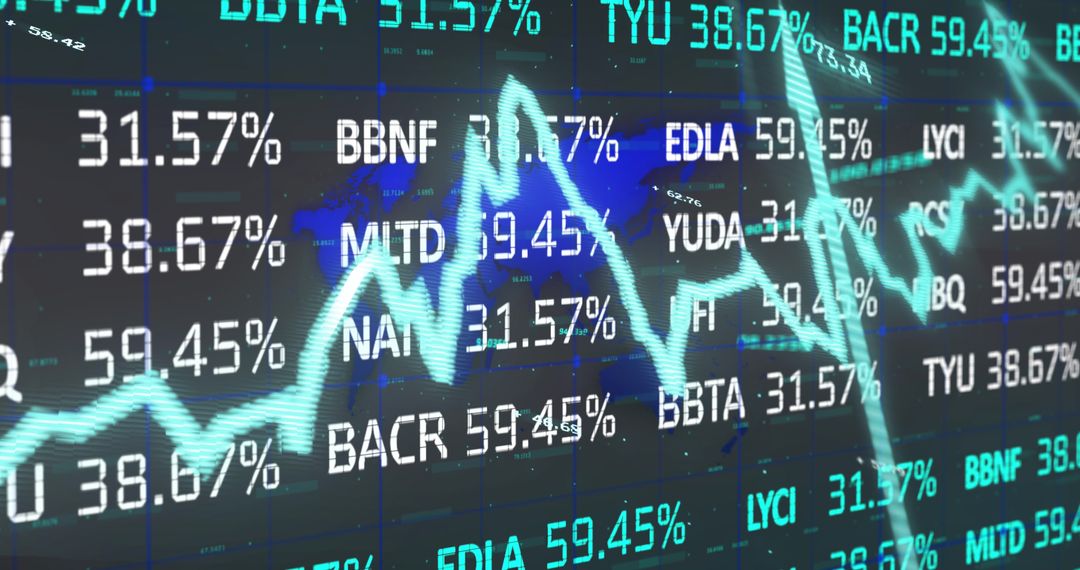
- Dynamic Stock Market Trends with Graphs on Digital Display
Dynamic Stock Market Trends with Graphs on Digital Display Image

Vibrant digital graphics displaying dynamic stock market trends, showcasing fluctuating financial charts in diverse colors. Useful for visuals in articles about investment strategies or stock market analytics, educational content on trading or economic analysis, and financial planning discussions.
Powered by 


2
downloads
downloads
Tags:
More
Credit Photo
If you would like to credit the Photo, here are some ways you can do so
Text Link
photo Link
<span class="text-link">
<span>
<a target="_blank" href=https://pikwizard.com/photo/dynamic-stock-market-trends-with-graphs-on-digital-display/36b1d19a984731c364b4b99f15cd6bac/>PikWizard</a>
</span>
</span>
<span class="image-link">
<span
style="margin: 0 0 20px 0; display: inline-block; vertical-align: middle; width: 100%;"
>
<a
target="_blank"
href="https://pikwizard.com/photo/dynamic-stock-market-trends-with-graphs-on-digital-display/36b1d19a984731c364b4b99f15cd6bac/"
style="text-decoration: none; font-size: 10px; margin: 0;"
>
<img src="https://pikwizard.com/pw/medium/36b1d19a984731c364b4b99f15cd6bac.jpg" style="margin: 0; width: 100%;" alt="" />
<p style="font-size: 12px; margin: 0;">PikWizard</p>
</a>
</span>
</span>
Free (free of charge)
Free for personal and commercial use.
Author: People Creations
Similar Free Stock Images

Premium


Premium


Premium


Premium


Premium


Premium


Premium


Premium


Premium


Premium


Premium


Premium


Premium


Premium


Premium


Premium


Premium


Premium


Premium


Premium


Premium


Premium


Premium


Premium