
- Home >
- Stock Photos >
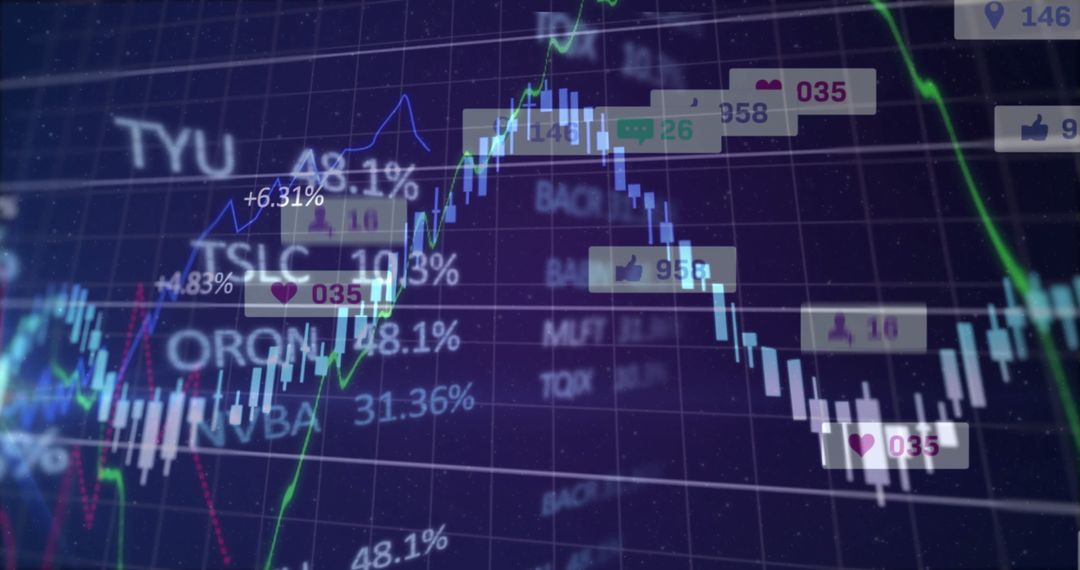
- Dynamic Stock Market Visualization with Trendlines and Tickers
Dynamic Stock Market Visualization with Trendlines and Tickers Image

Dynamic display of financial data ideal for presentations or articles on stock trading and investment strategies. Powerful tool for visualizing complex market trends and illustrating investment opportunities in finance-focused contexts. Very useful for updating content involving latest financial technologies or economic analysis.
Powered by  - Get 15% off with code: PIKWIZARD15


0
downloads
downloads
Tags:
More
Credit Photo
If you would like to credit the Photo, here are some ways you can do so
Text Link
photo Link
<span class="text-link">
<span>
<a target="_blank" href=https://pikwizard.com/photo/dynamic-stock-market-visualization-with-trendlines-and-tickers/009a0dcb41e38ef4f902a61a54ba86dc/>PikWizard</a>
</span>
</span>
<span class="image-link">
<span
style="margin: 0 0 20px 0; display: inline-block; vertical-align: middle; width: 100%;"
>
<a
target="_blank"
href="https://pikwizard.com/photo/dynamic-stock-market-visualization-with-trendlines-and-tickers/009a0dcb41e38ef4f902a61a54ba86dc/"
style="text-decoration: none; font-size: 10px; margin: 0;"
>
<img src="https://pikwizard.com/pw/medium/009a0dcb41e38ef4f902a61a54ba86dc.jpg" style="margin: 0; width: 100%;" alt="" />
<p style="font-size: 12px; margin: 0;">PikWizard</p>
</a>
</span>
</span>
Free (free of charge)
Free for personal and commercial use.
Author: People Creations
Similar Free Stock Images

Premium


Premium


Premium


Premium


Premium


Premium


Premium


Premium


Premium


Premium


Premium


Premium


Premium


Premium


Premium


Premium


Premium


Premium


Premium


Premium


Premium


Premium


Premium


Premium

