- Home >
- Stock Photos >
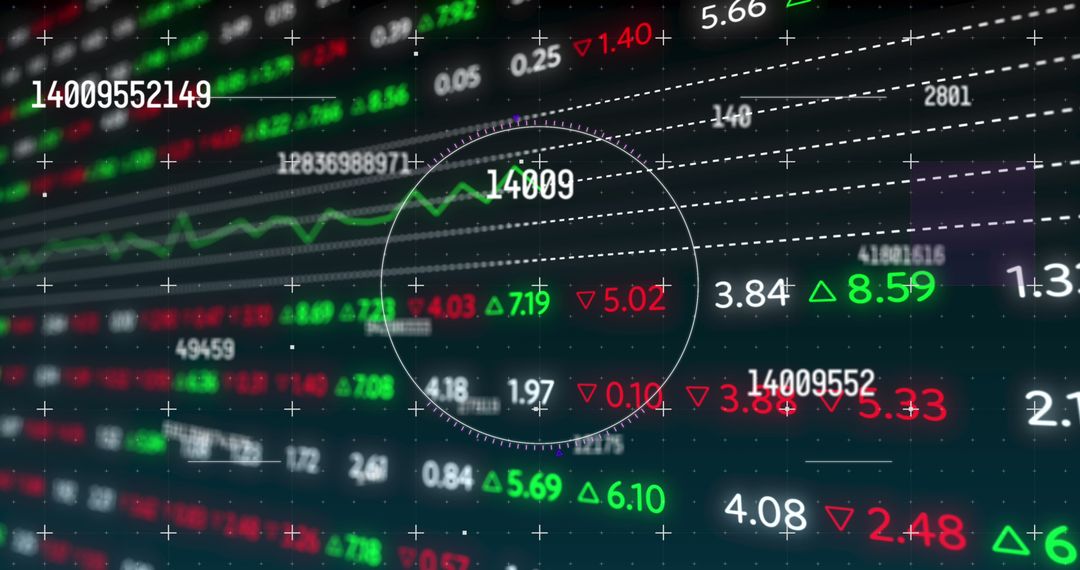
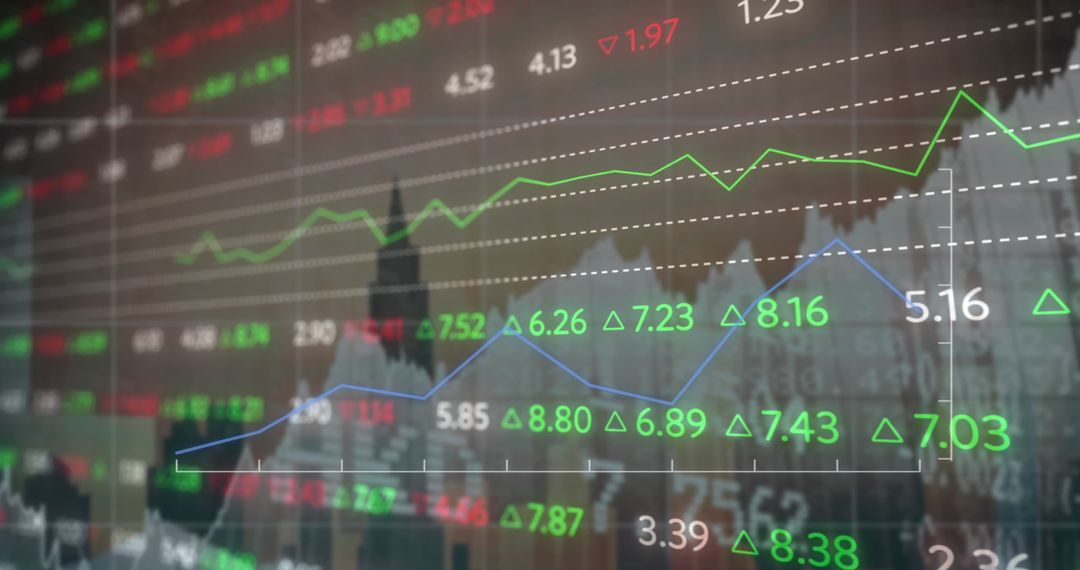
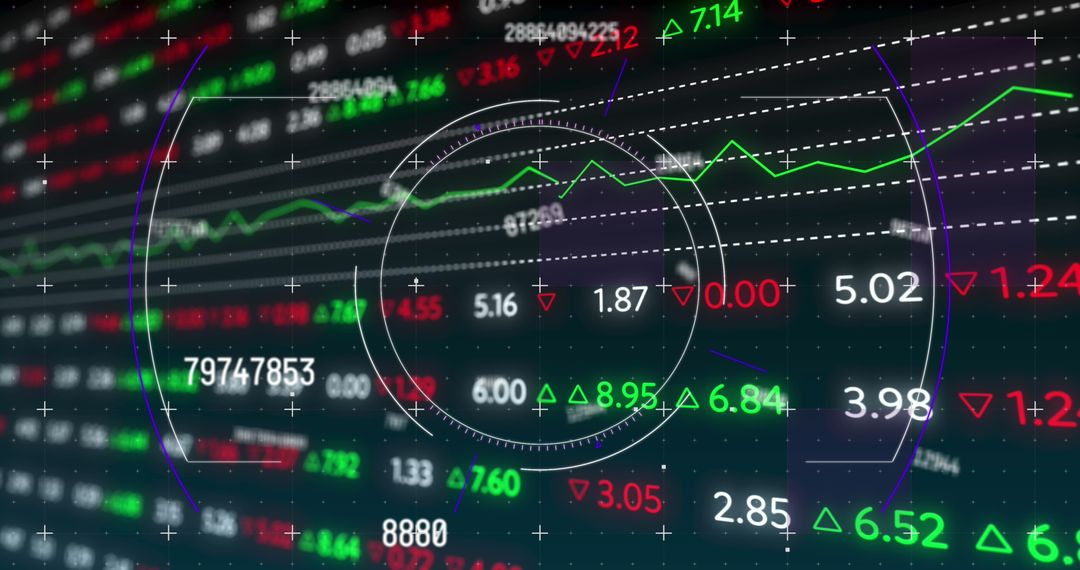
- Dynamic Stock Price Movement with Colorful Financial Graphs
Dynamic Stock Price Movement with Colorful Financial Graphs Image

Complex graphs of stock price fluctuations with colorful trend lines represent financial securities market analysis trading concepts. Useful for illustrating finance, economy, investment strategies or market trends in media publications, educational materials, and investor presentations.
Powered by  - Get 15% off with code: PIKWIZARD15


2
downloads
downloads
Tags:
More
Credit Photo
If you would like to credit the Photo, here are some ways you can do so
Text Link
photo Link
<span class="text-link">
<span>
<a target="_blank" href=https://pikwizard.com/photo/dynamic-stock-price-movement-with-colorful-financial-graphs/3011b50a9f4a40235abab3416f5314fa/>PikWizard</a>
</span>
</span>
<span class="image-link">
<span
style="margin: 0 0 20px 0; display: inline-block; vertical-align: middle; width: 100%;"
>
<a
target="_blank"
href="https://pikwizard.com/photo/dynamic-stock-price-movement-with-colorful-financial-graphs/3011b50a9f4a40235abab3416f5314fa/"
style="text-decoration: none; font-size: 10px; margin: 0;"
>
<img src="https://pikwizard.com/pw/medium/3011b50a9f4a40235abab3416f5314fa.jpg" style="margin: 0; width: 100%;" alt="" />
<p style="font-size: 12px; margin: 0;">PikWizard</p>
</a>
</span>
</span>
Free (free of charge)
Free for personal and commercial use.
Author: People Creations
Similar Free Stock Images

Premium


Premium


Premium


Premium


Premium


Premium


Premium


Premium


Premium


Premium


Premium


Premium


Premium


Premium


Premium


Premium


Premium


Premium


Premium


Premium


Premium


Premium


Premium


Premium