
- Home >
- Stock Photos >
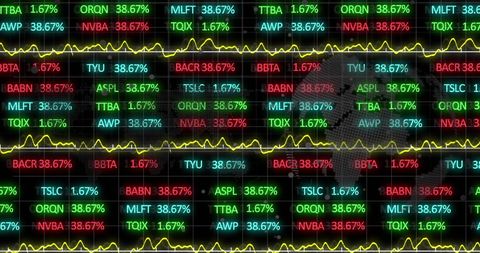
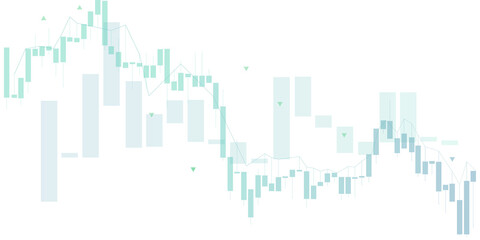
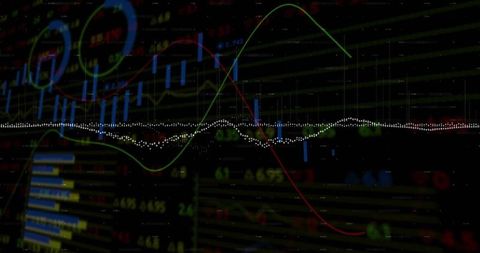
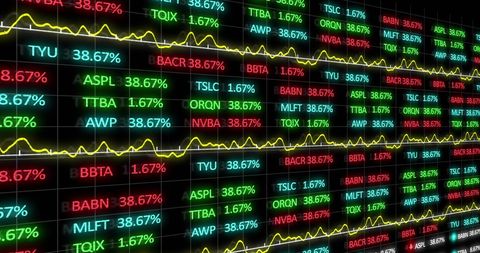
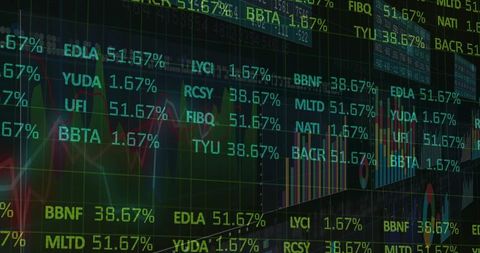
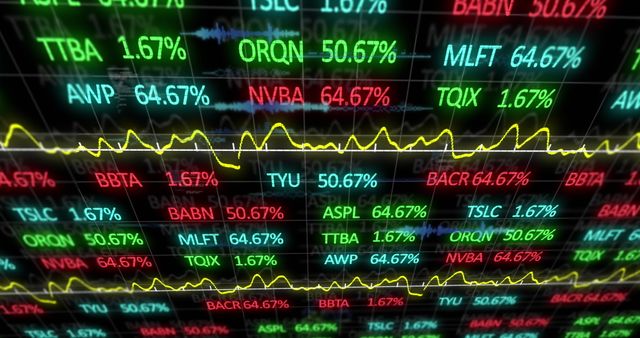
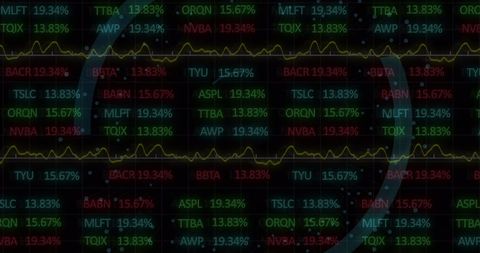
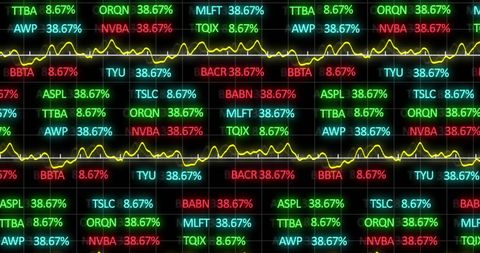
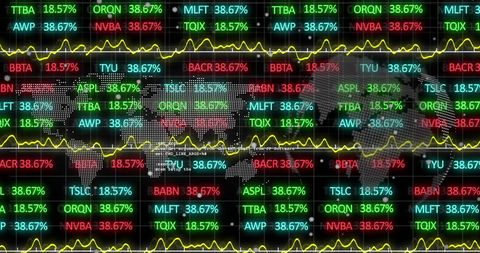
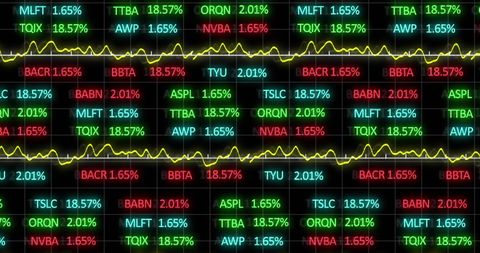
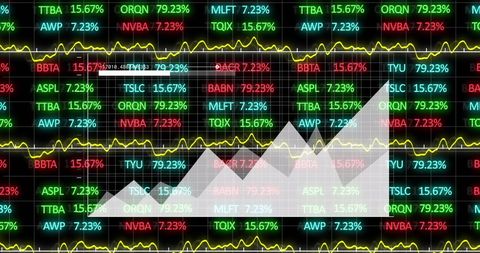
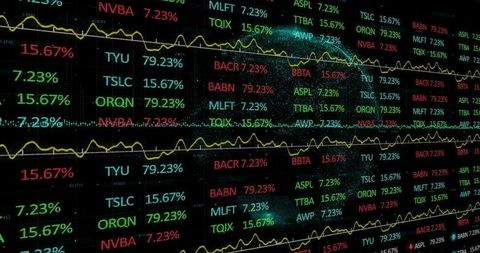
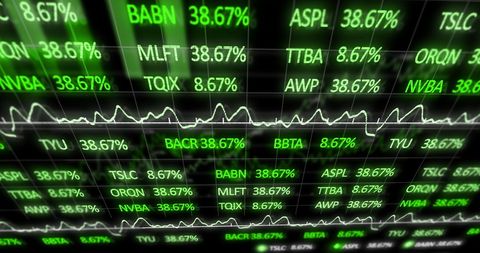
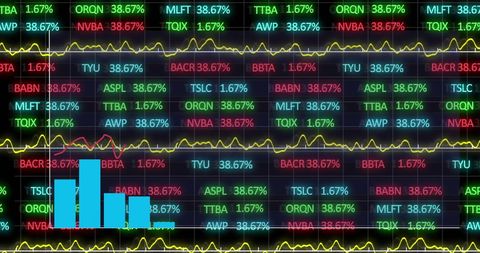
- Dynamic Stocks and Trading Data Visualization
Dynamic Stocks and Trading Data Visualization Image

Colorful bar and line graphs depicted on digital display showcasing stock market analysis and trading data. Useful for illustrating financial reports, global economy trends, economic analysis, and investment strategies.
Powered by 


downloads
Tags:
More
Credit Photo
If you would like to credit the Photo, here are some ways you can do so
Text Link
photo Link
<span class="text-link">
<span>
<a target="_blank" href=https://pikwizard.com/photo/dynamic-stocks-and-trading-data-visualization/25df160251a13c4740b319cefd088178/>PikWizard</a>
</span>
</span>
<span class="image-link">
<span
style="margin: 0 0 20px 0; display: inline-block; vertical-align: middle; width: 100%;"
>
<a
target="_blank"
href="https://pikwizard.com/photo/dynamic-stocks-and-trading-data-visualization/25df160251a13c4740b319cefd088178/"
style="text-decoration: none; font-size: 10px; margin: 0;"
>
<img src="https://pikwizard.com/pw/medium/25df160251a13c4740b319cefd088178.jpg" style="margin: 0; width: 100%;" alt="" />
<p style="font-size: 12px; margin: 0;">PikWizard</p>
</a>
</span>
</span>
Free (free of charge)
Free for personal and commercial use.
Author: People Creations
Similar Free Stock Images

Premium


Premium

Premium


Premium

Premium

Premium


Premium


Premium


Premium

Premium

Premium

Premium


Premium


Premium


Premium


Premium


Premium


Premium

Premium


Premium


Premium


Premium


Premium

AI


Premium


Premium


Explore More Free Stock Images