
- Home >
- Stock Photos >
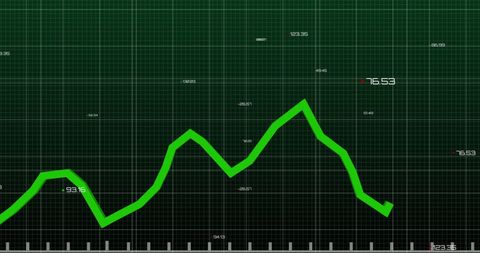
- Dynamic Time-Series Data Visualization on Digital Dashboard
Dynamic Time-Series Data Visualization on Digital Dashboard Image

This visualization showcases complex time-series data displayed with multicolored charts on a digital dashboard. Perfect for use in technology, finance, or statistical analysis content, it illustrates concepts such as real-time data tracking, analytics dashboards, or user interface design enhancements. It could also enhance presentations or online content concerning data science or interactive dashboards.
Powered by  - Get 15% off with code: PIKWIZARD15


downloads
Tags:
More
Credit Photo
If you would like to credit the Photo, here are some ways you can do so
Text Link
photo Link
<span class="text-link">
<span>
<a target="_blank" href=https://pikwizard.com/photo/dynamic-time-series-data-visualization-on-digital-dashboard/b0c6c580e760baa35b5d8bf78ca1b586/>PikWizard</a>
</span>
</span>
<span class="image-link">
<span
style="margin: 0 0 20px 0; display: inline-block; vertical-align: middle; width: 100%;"
>
<a
target="_blank"
href="https://pikwizard.com/photo/dynamic-time-series-data-visualization-on-digital-dashboard/b0c6c580e760baa35b5d8bf78ca1b586/"
style="text-decoration: none; font-size: 10px; margin: 0;"
>
<img src="https://pikwizard.com/pw/medium/b0c6c580e760baa35b5d8bf78ca1b586.jpg" style="margin: 0; width: 100%;" alt="" />
<p style="font-size: 12px; margin: 0;">PikWizard</p>
</a>
</span>
</span>
Free (free of charge)
Free for personal and commercial use.
Author: Authentic Images
Similar Free Stock Images

Premium


Premium

Premium


Premium

Premium


Premium


Premium

Premium


Premium


Premium


Premium

Premium

Premium


Premium


Premium


Premium


Premium


Premium


Premium


Premium


Premium


Premium


Premium


Premium


Premium


Explore More Free Stock Images