- Home >
- Stock Photos >
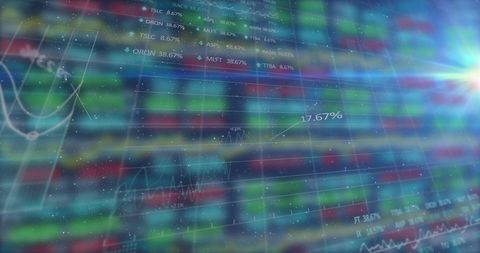
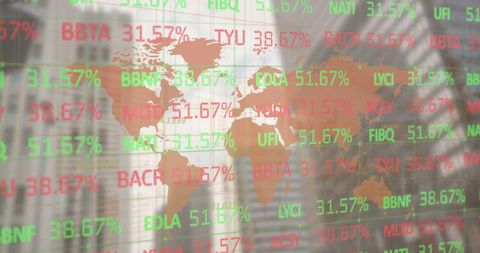
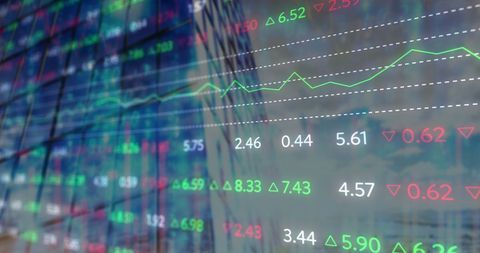
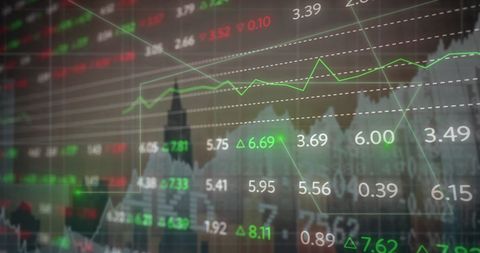
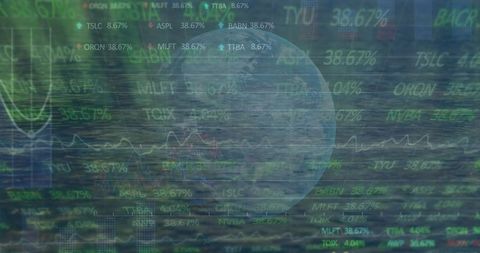
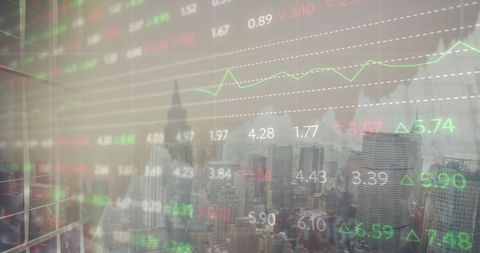
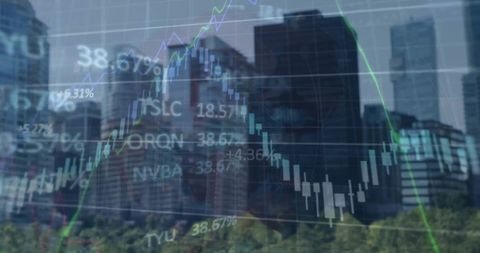
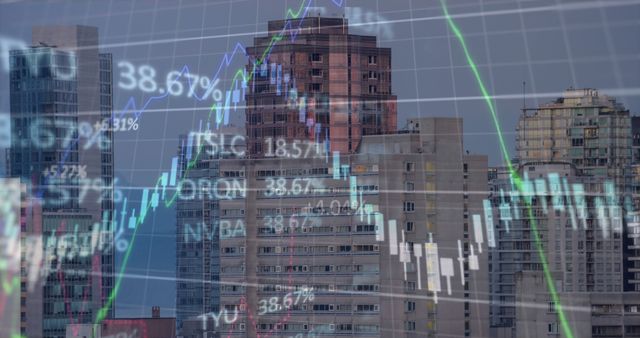
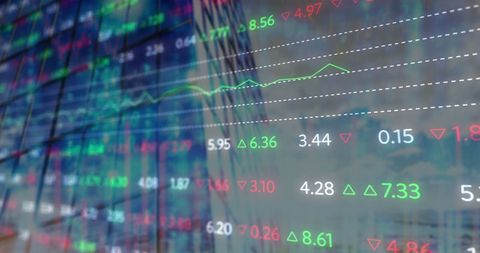
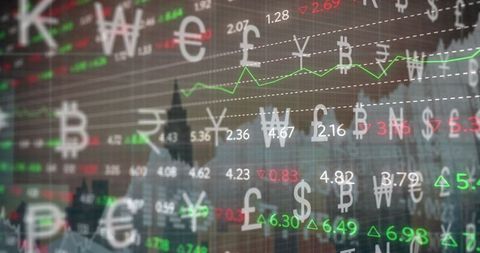
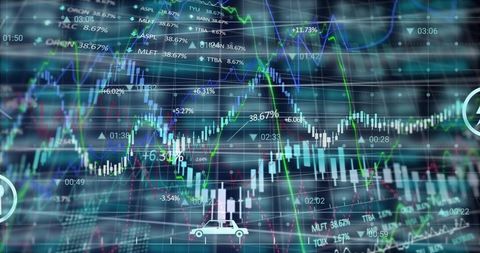
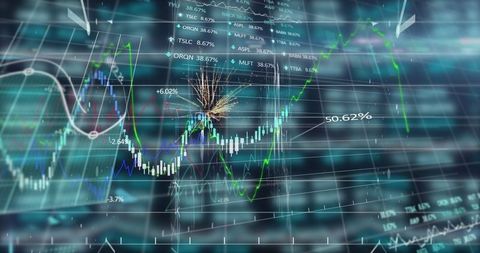
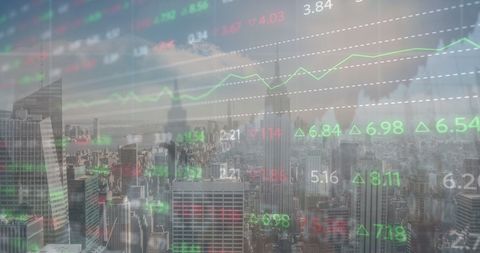
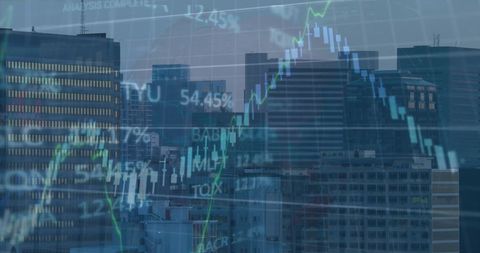
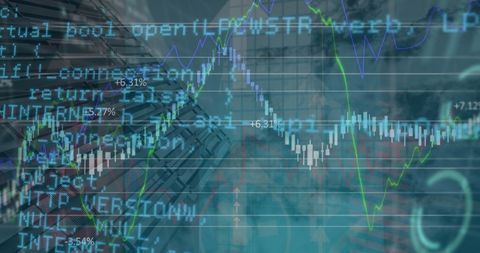
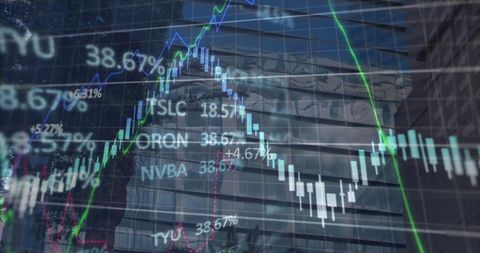
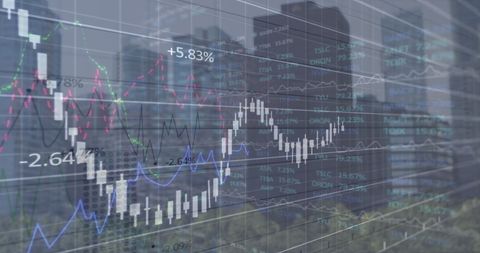
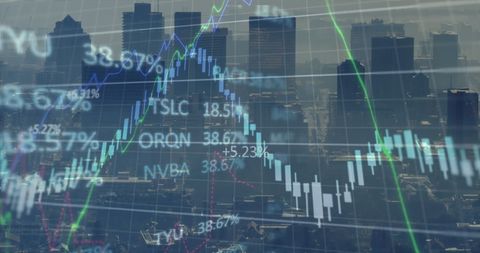
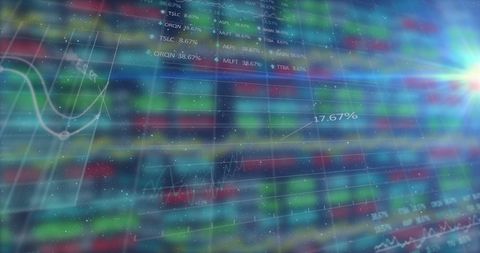
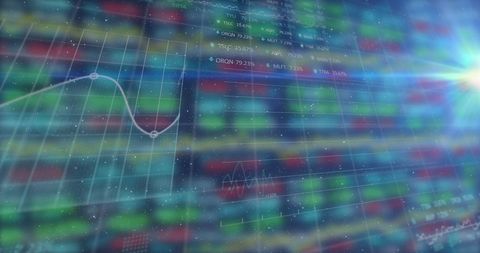
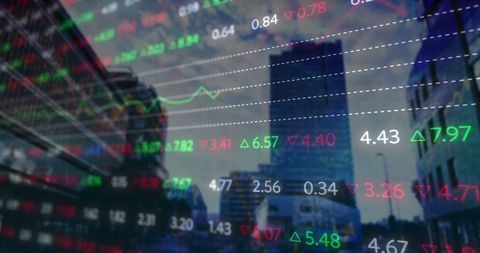
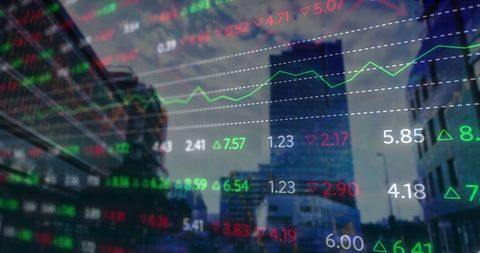
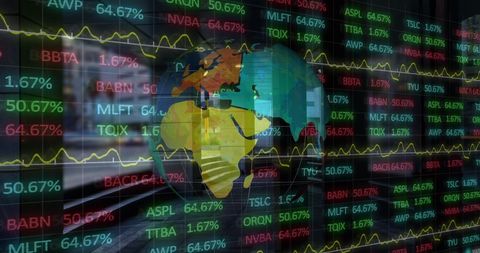
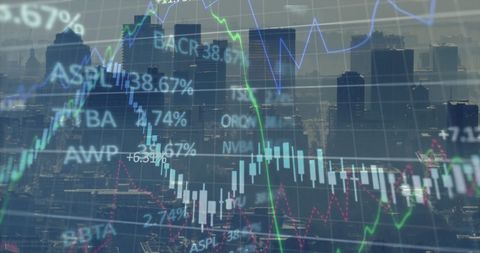
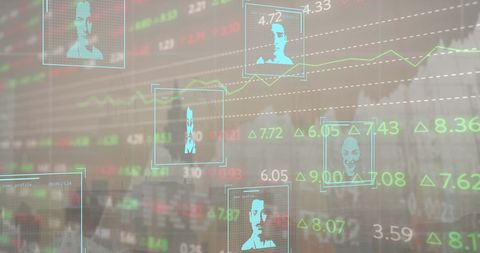
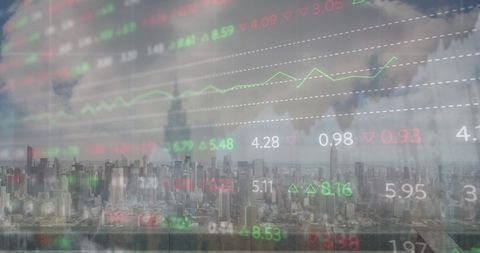
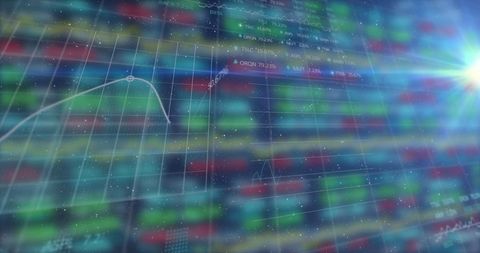
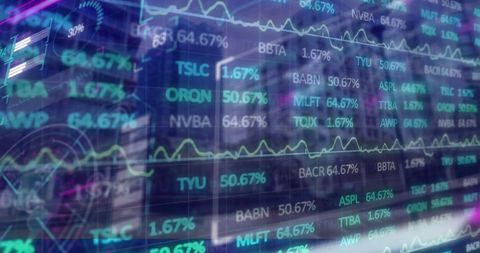
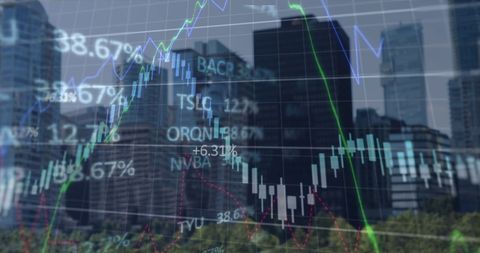
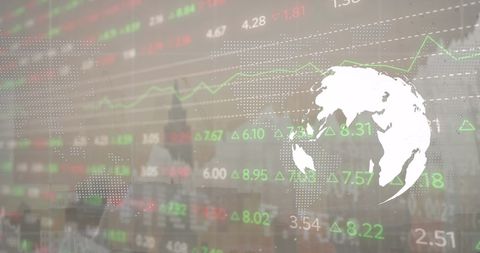
- Dynamic Trading Chart with Candlesticks and Trend Analysis
Dynamic Trading Chart with Candlesticks and Trend Analysis Image
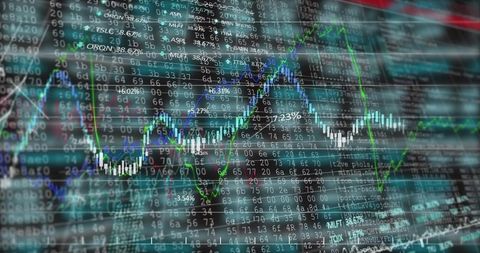
Showcasing a detailed trading terminal with fluctuating candlestick charts and trend lines, ideal for financial presentations, investment analysis, and technology driven projects. Useful for illustrating concepts in data visualization, stock market investments, or as a backdrop in fintech conferences.

downloads
Tags:
More
Credit Photo
If you would like to credit the Photo, here are some ways you can do so
Text Link
photo Link
<span class="text-link">
<span>
<a target="_blank" href=https://pikwizard.com/photo/dynamic-trading-chart-with-candlesticks-and-trend-analysis/cf406db2e07646a1f42ab4410e7b4be7/>PikWizard</a>
</span>
</span>
<span class="image-link">
<span
style="margin: 0 0 20px 0; display: inline-block; vertical-align: middle; width: 100%;"
>
<a
target="_blank"
href="https://pikwizard.com/photo/dynamic-trading-chart-with-candlesticks-and-trend-analysis/cf406db2e07646a1f42ab4410e7b4be7/"
style="text-decoration: none; font-size: 10px; margin: 0;"
>
<img src="https://pikwizard.com/pw/medium/cf406db2e07646a1f42ab4410e7b4be7.jpg" style="margin: 0; width: 100%;" alt="" />
<p style="font-size: 12px; margin: 0;">PikWizard</p>
</a>
</span>
</span>
Free (free of charge)
Free for personal and commercial use.
Author: Awesome Content