
- Home >
- Stock Photos >
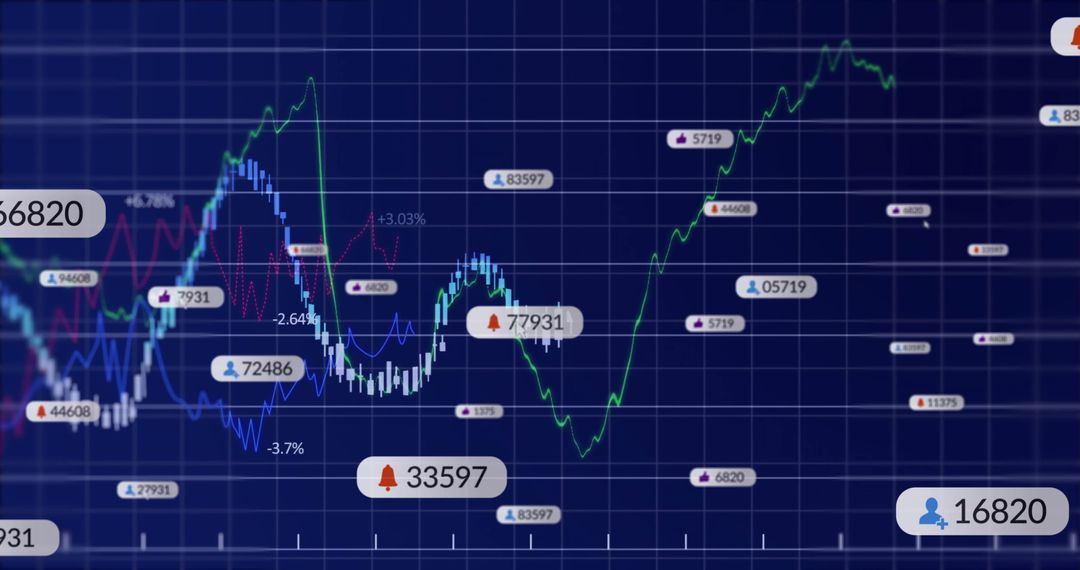
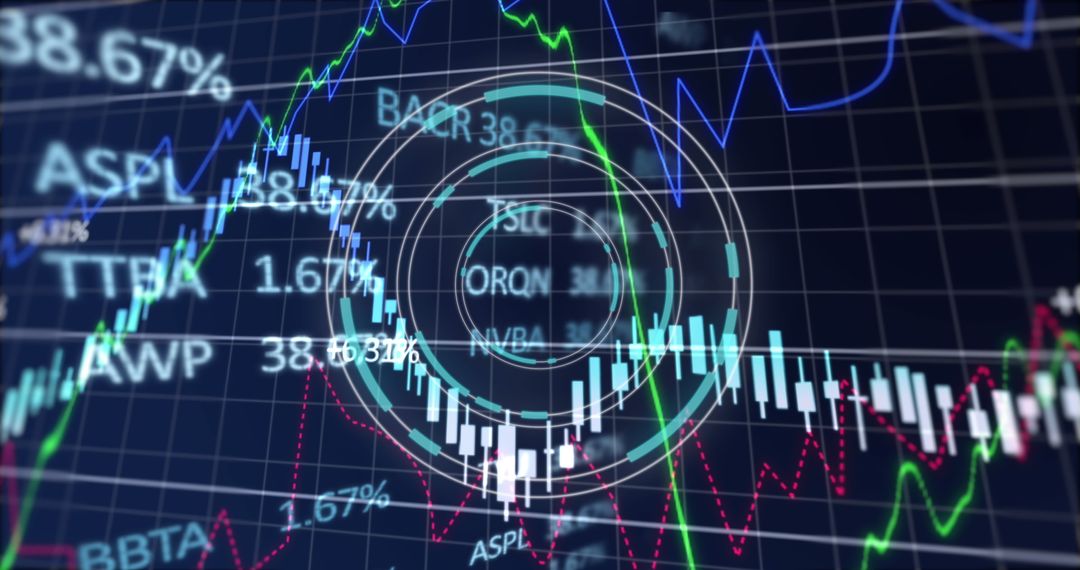
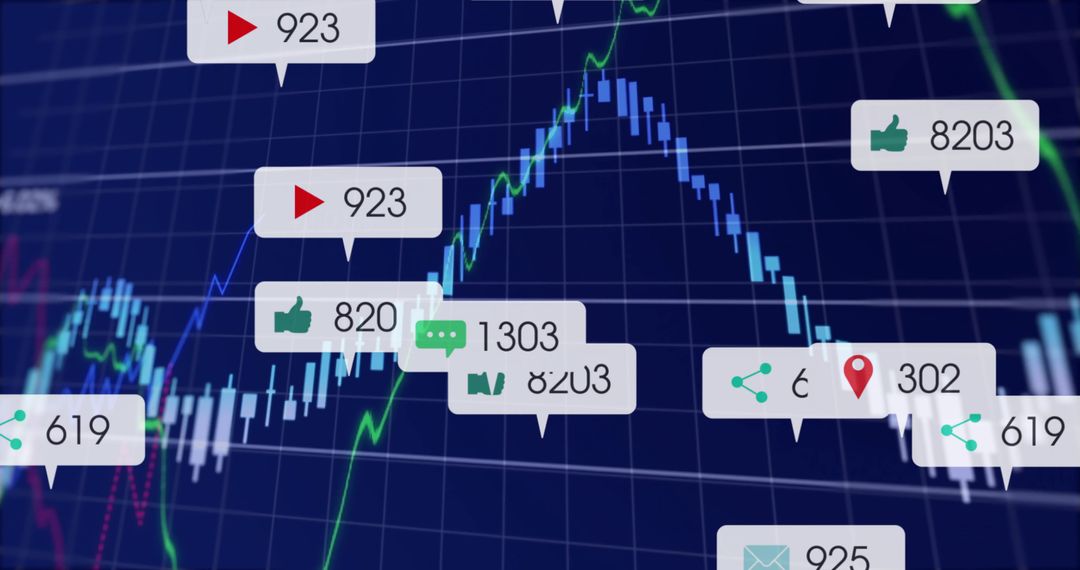
- Dynamic Trading Dashboard on Digital Blue Grid Display
Dynamic Trading Dashboard on Digital Blue Grid Display Image

This visual representation effectively showcases a digital trading dashboard with elements like candlestick charts and line graphs, making it highly relevant for understanding market trends and financial analytics. It uniquely displays stock symbols and interactions with digital icons, emphasizing technology in the stock trading landscape. Ideal for use in articles or presentations focusing on financial market analysis, teaching trading strategies, or illustrating the impact of technology in investment decisions.
Powered by  - Get 15% off with code: PIKWIZARD15


0
downloads
downloads
Tags:
More
Credit Photo
If you would like to credit the Photo, here are some ways you can do so
Text Link
photo Link
<span class="text-link">
<span>
<a target="_blank" href=https://pikwizard.com/photo/dynamic-trading-dashboard-on-digital-blue-grid-display/80bd1c07f7423c7e046ea5a8925e5d51/>PikWizard</a>
</span>
</span>
<span class="image-link">
<span
style="margin: 0 0 20px 0; display: inline-block; vertical-align: middle; width: 100%;"
>
<a
target="_blank"
href="https://pikwizard.com/photo/dynamic-trading-dashboard-on-digital-blue-grid-display/80bd1c07f7423c7e046ea5a8925e5d51/"
style="text-decoration: none; font-size: 10px; margin: 0;"
>
<img src="https://pikwizard.com/pw/medium/80bd1c07f7423c7e046ea5a8925e5d51.jpg" style="margin: 0; width: 100%;" alt="" />
<p style="font-size: 12px; margin: 0;">PikWizard</p>
</a>
</span>
</span>
Free (free of charge)
Free for personal and commercial use.
Author: Awesome Content
Similar Free Stock Images

Premium


Premium


Premium


Premium


Premium


Premium


Premium


Premium


Premium


Premium


Premium


Premium


Premium


Premium


Premium


Premium


Premium


Premium


Premium


Premium


Premium


Premium


Premium


Premium

