
- Home >
- Stock Photos >
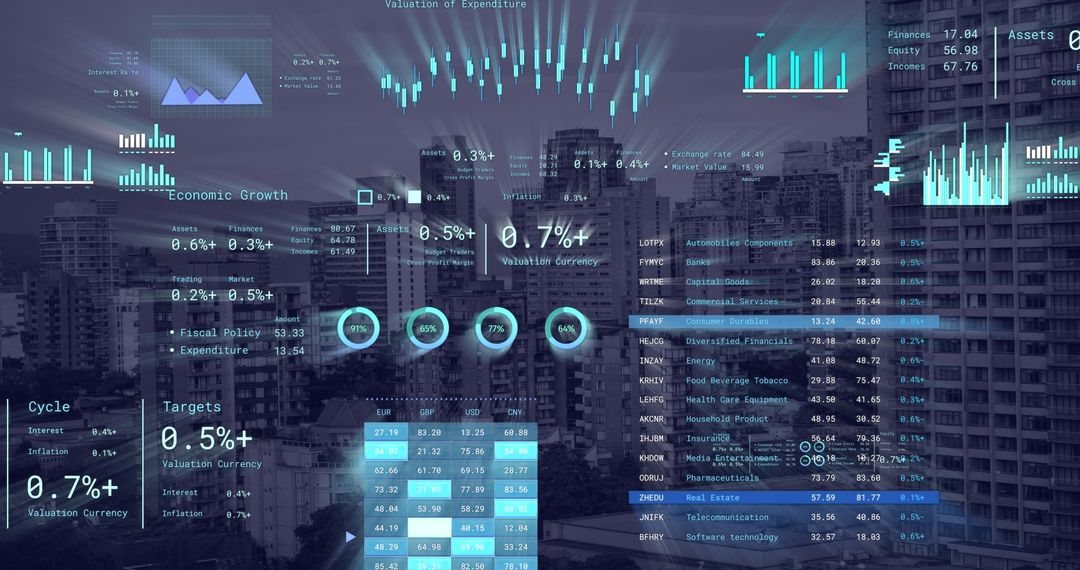
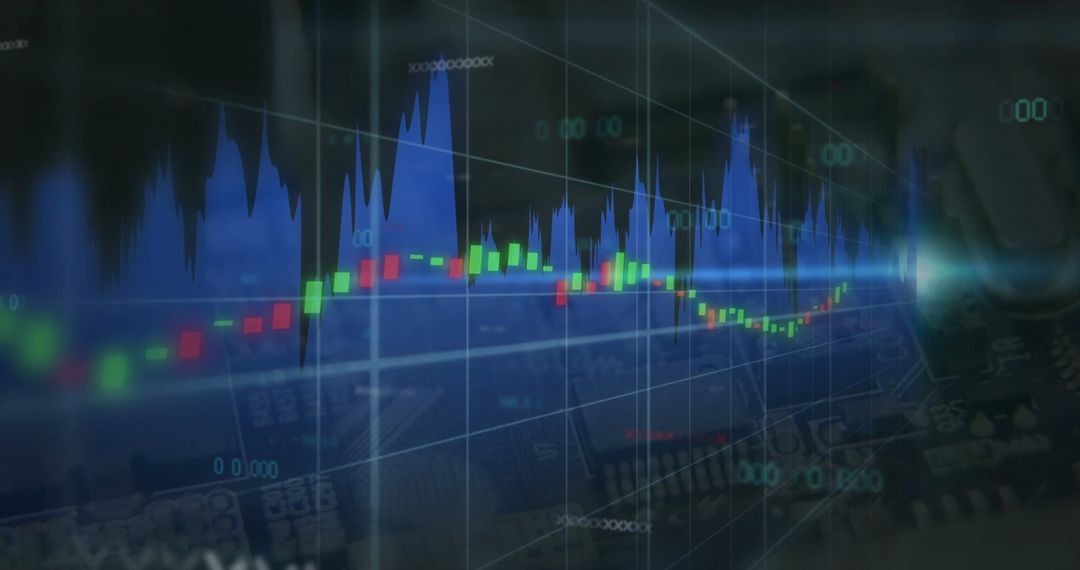
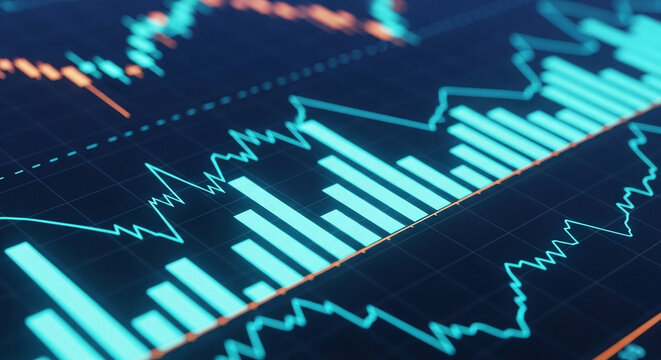
- Dynamic Trading Dashboard with Candlestick and Area Graphs
Dynamic Trading Dashboard with Candlestick and Area Graphs Image
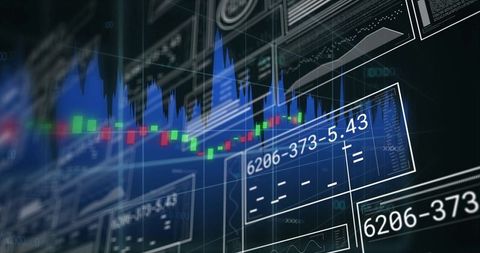
This visualization offers a futuristic look into financial market trends with overlaying charts and dashboard metrics. It is perfect for projects involving financial analytics, technology briefs, economic forecasts or digital transformation in markets.
Powered by 


2
downloads
downloads
Tags:
More
Credit Photo
If you would like to credit the Photo, here are some ways you can do so
Text Link
photo Link
<span class="text-link">
<span>
<a target="_blank" href=https://pikwizard.com/photo/dynamic-trading-dashboard-with-candlestick-and-area-graphs/2706e0822f2a49dee756253442b288b9/>PikWizard</a>
</span>
</span>
<span class="image-link">
<span
style="margin: 0 0 20px 0; display: inline-block; vertical-align: middle; width: 100%;"
>
<a
target="_blank"
href="https://pikwizard.com/photo/dynamic-trading-dashboard-with-candlestick-and-area-graphs/2706e0822f2a49dee756253442b288b9/"
style="text-decoration: none; font-size: 10px; margin: 0;"
>
<img src="https://pikwizard.com/pw/medium/2706e0822f2a49dee756253442b288b9.jpg" style="margin: 0; width: 100%;" alt="" />
<p style="font-size: 12px; margin: 0;">PikWizard</p>
</a>
</span>
</span>
Free (free of charge)
Free for personal and commercial use.
Author: People Creations
Similar Free Stock Images

Premium


Premium


Premium


Premium


Premium


Premium


Premium


Premium


Premium


Premium


Premium


Premium


Premium


Premium


Premium


Premium


Premium


Premium


Premium


Premium


Premium


Premium


Premium


Premium

