- Home >
- Stock Photos >
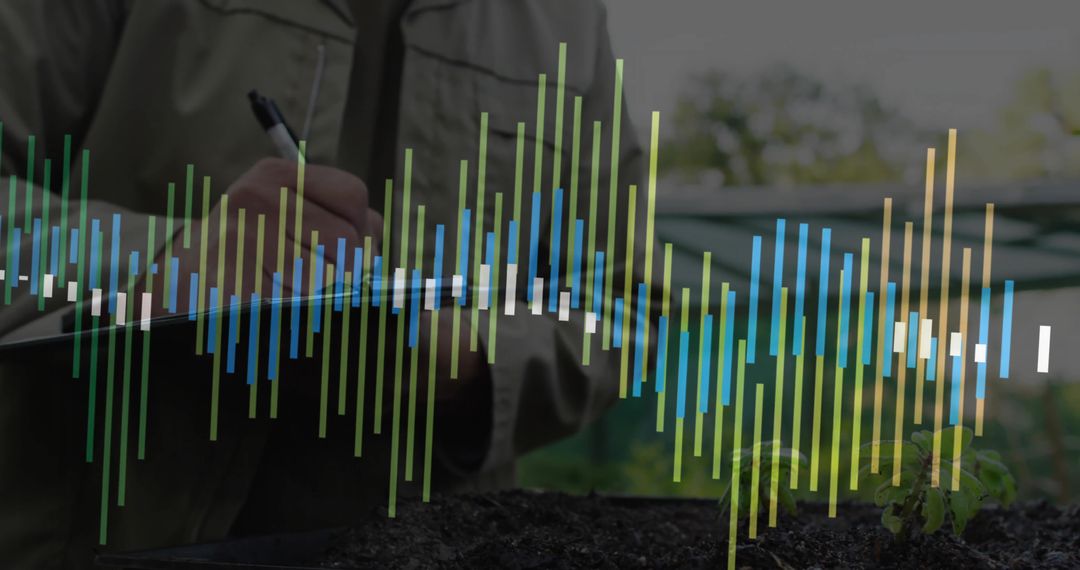
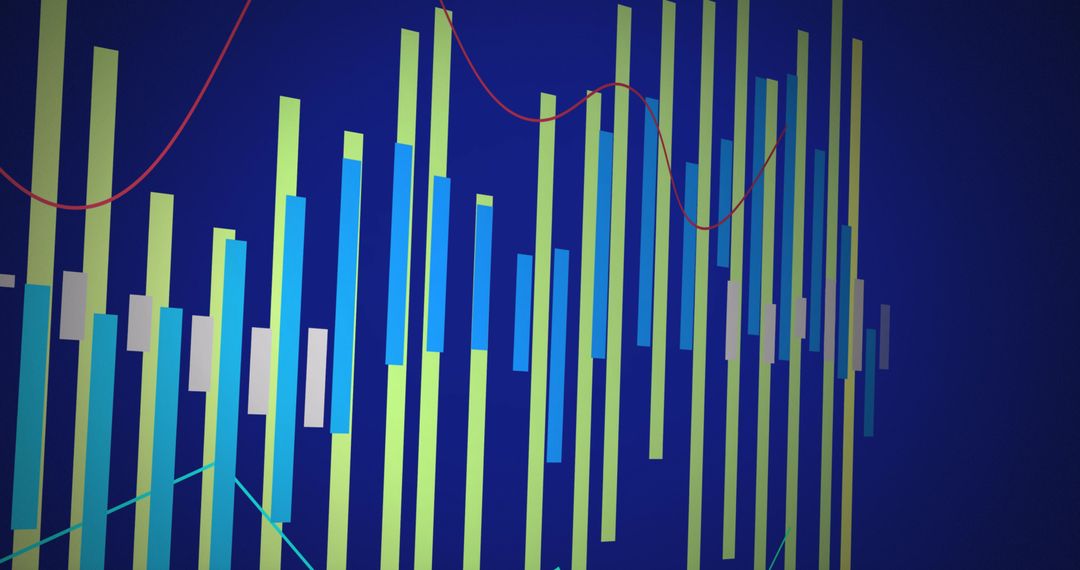
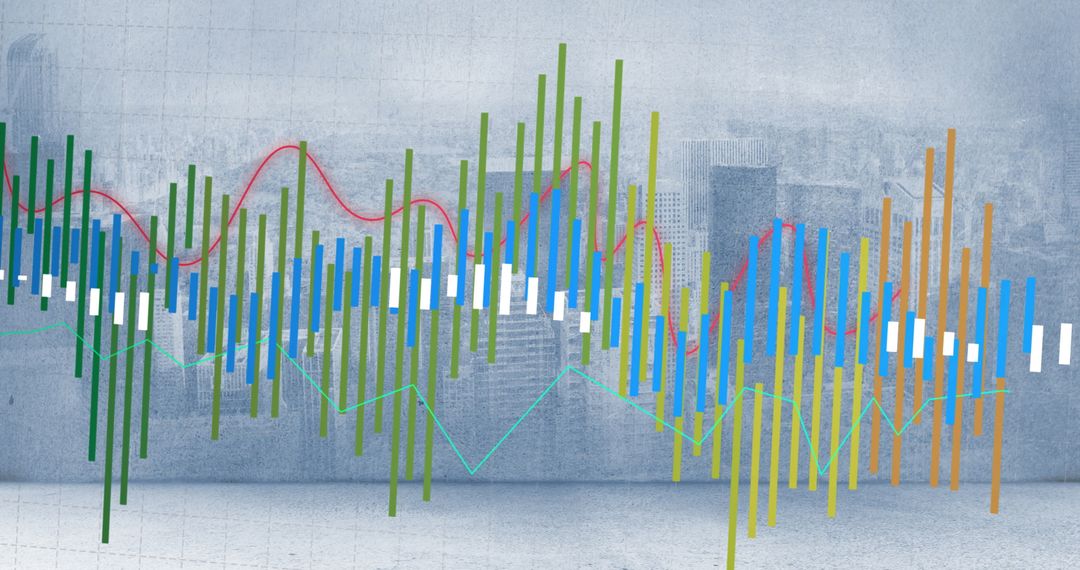
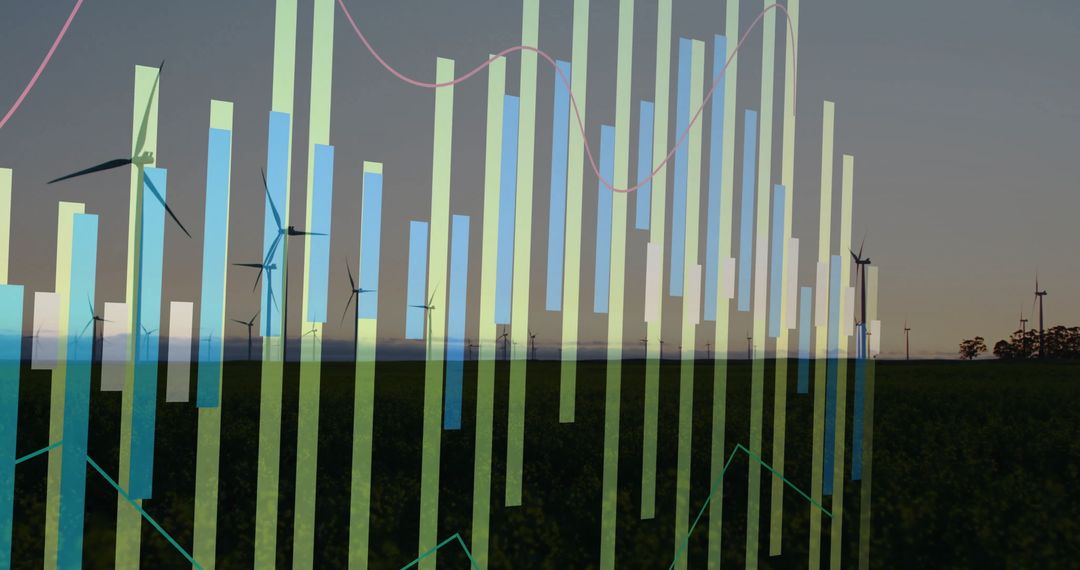
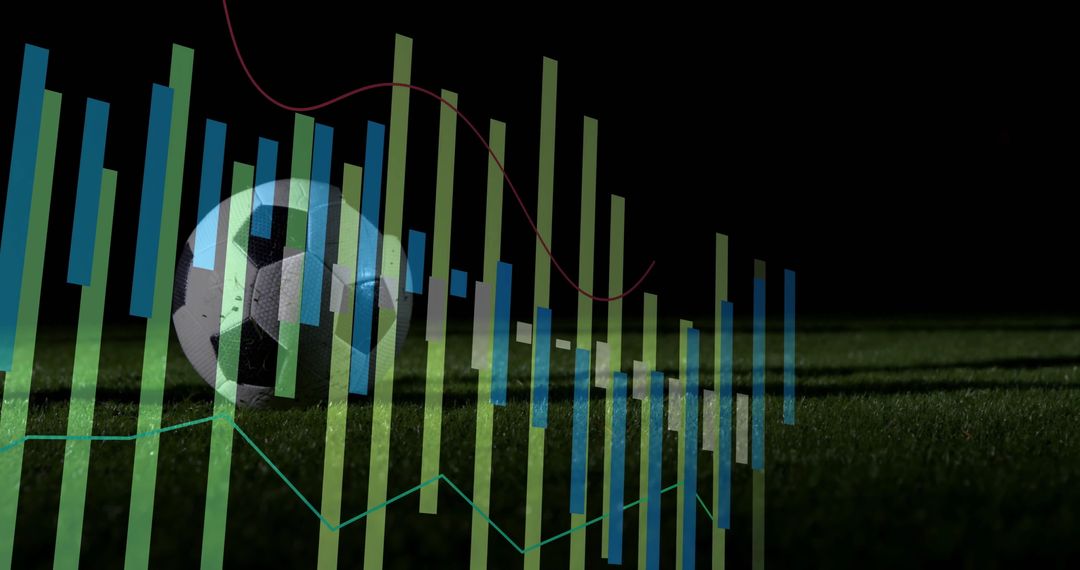
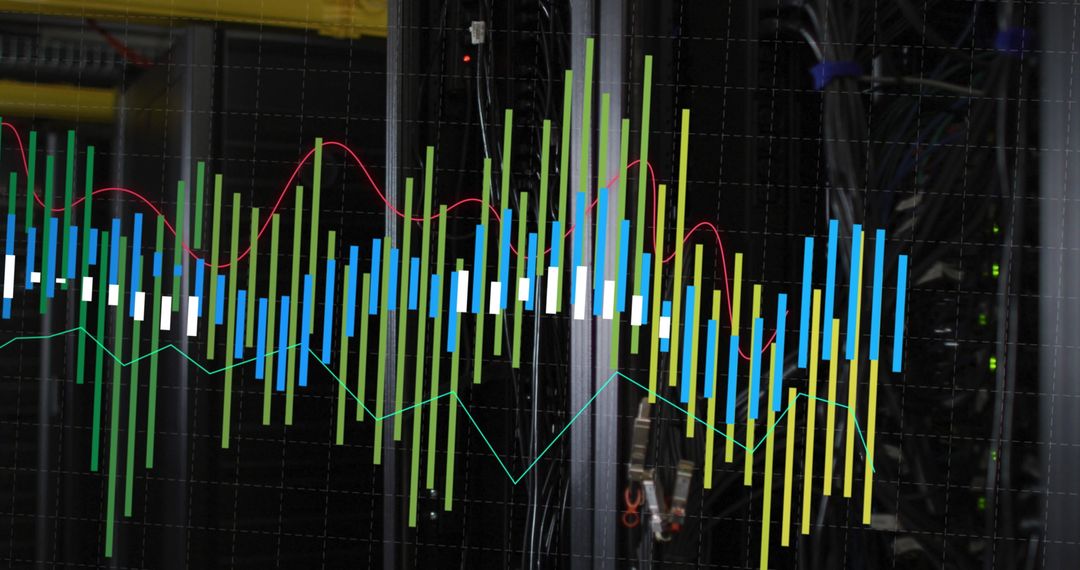
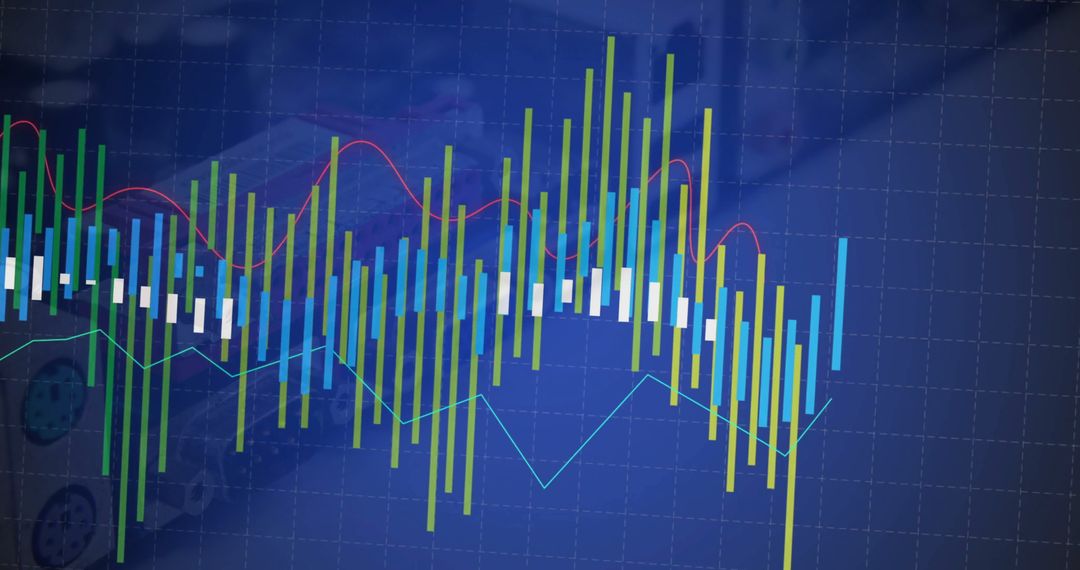
- Dynamic Vertical Bar Chart with Trend Lines on Dashboard
Dynamic Vertical Bar Chart with Trend Lines on Dashboard Image

Vibrant vertical bar chart complemented by red and turquoise line graphs, ideal for presentations, reports, and digital content concerning data analysis, business projections, or technological dashboards. Enhances content that involves showcasing trends, financial statistics, or strategic insights with a modern visually captivating style.
Powered by  - Get 15% off with code: PIKWIZARD15


0
downloads
downloads
Tags:
More
Credit Photo
If you would like to credit the Photo, here are some ways you can do so
Text Link
photo Link
<span class="text-link">
<span>
<a target="_blank" href=https://pikwizard.com/photo/dynamic-vertical-bar-chart-with-trend-lines-on-dashboard/2dc6b00c29cd23390bc9195a1b87fa97/>PikWizard</a>
</span>
</span>
<span class="image-link">
<span
style="margin: 0 0 20px 0; display: inline-block; vertical-align: middle; width: 100%;"
>
<a
target="_blank"
href="https://pikwizard.com/photo/dynamic-vertical-bar-chart-with-trend-lines-on-dashboard/2dc6b00c29cd23390bc9195a1b87fa97/"
style="text-decoration: none; font-size: 10px; margin: 0;"
>
<img src="https://pikwizard.com/pw/medium/2dc6b00c29cd23390bc9195a1b87fa97.jpg" style="margin: 0; width: 100%;" alt="" />
<p style="font-size: 12px; margin: 0;">PikWizard</p>
</a>
</span>
</span>
Free (free of charge)
Free for personal and commercial use.
Author: Creative Art
Similar Free Stock Images

Premium


Premium


Premium


Premium


Premium


Premium


Premium


Premium


Premium


Premium


Premium


Premium


Premium


Premium


Premium


Premium


Premium


Premium


Premium


Premium


Premium


Premium

Premium


Premium