
- Home >
- Stock Photos >
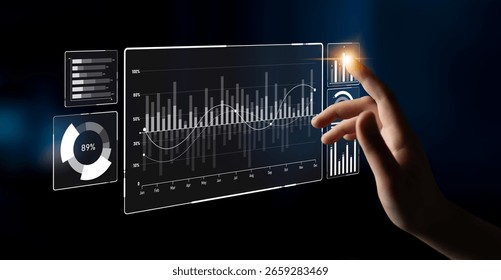
- Dynamic Visual Financial Data Charts in Digital Workspace
Dynamic Visual Financial Data Charts in Digital Workspace Image

Digital display of various financial data charts including pie, bar, candlestick, and line representations with percentage labels and a world map. Ideal for illustrating concepts in investment, business analytics, and financial technology. Suitable for use in presentations, website headers, and educational materials related to data analysis and professional environments.
Powered by  - Get 15% off with code: PIKWIZARD15


downloads
Tags:
More
Credit Photo
If you would like to credit the Photo, here are some ways you can do so
Text Link
photo Link
<span class="text-link">
<span>
<a target="_blank" href=https://pikwizard.com/photo/dynamic-visual-financial-data-charts-in-digital-workspace/89e0681622eaba58bf3b5f0e791f75f3/>PikWizard</a>
</span>
</span>
<span class="image-link">
<span
style="margin: 0 0 20px 0; display: inline-block; vertical-align: middle; width: 100%;"
>
<a
target="_blank"
href="https://pikwizard.com/photo/dynamic-visual-financial-data-charts-in-digital-workspace/89e0681622eaba58bf3b5f0e791f75f3/"
style="text-decoration: none; font-size: 10px; margin: 0;"
>
<img src="https://pikwizard.com/pw/medium/89e0681622eaba58bf3b5f0e791f75f3.jpg" style="margin: 0; width: 100%;" alt="" />
<p style="font-size: 12px; margin: 0;">PikWizard</p>
</a>
</span>
</span>
Free (free of charge)
Free for personal and commercial use.
Author: Creative Art
Similar Free Stock Images

Premium


Premium

Premium


Premium


Premium


Premium


Premium


Premium


Premium

Premium


Premium


Premium

Premium


Premium


Premium


Premium


Premium


Premium


Premium


Premium


Premium

Premium


Premium


Premium


Premium

Explore More Free Stock Images