
- Home >
- Stock Photos >
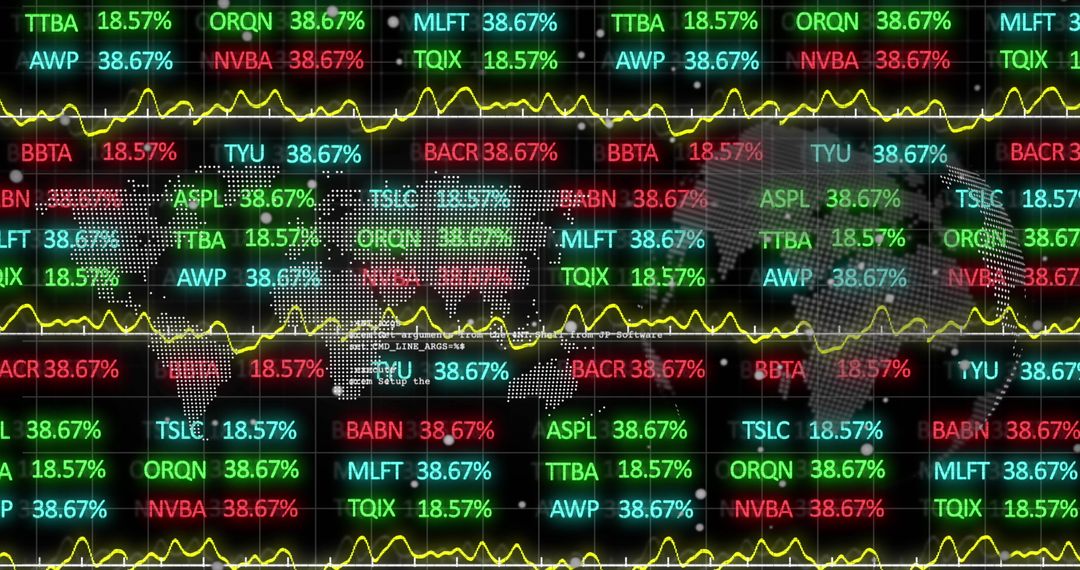
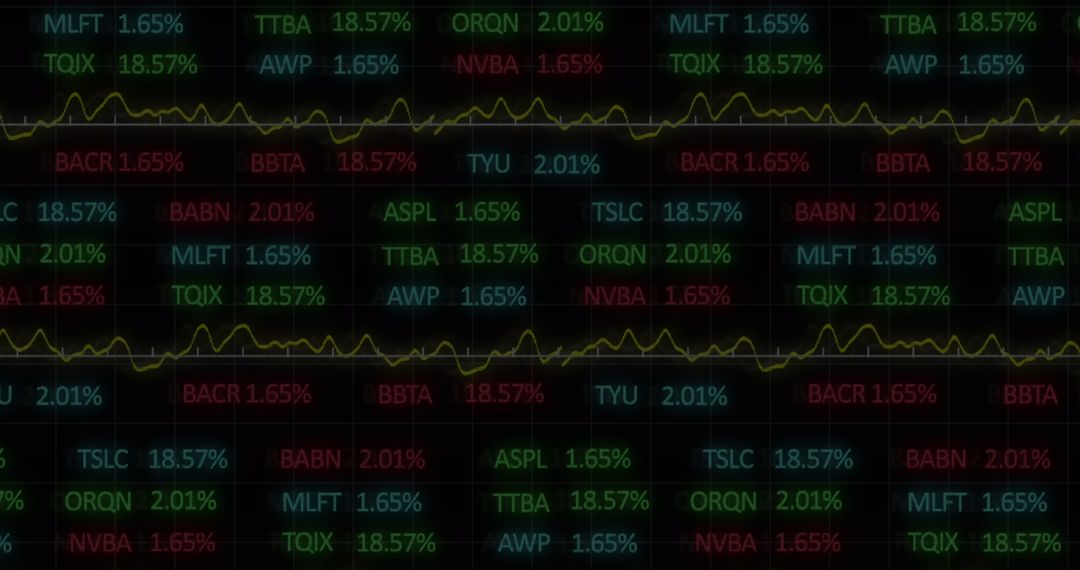
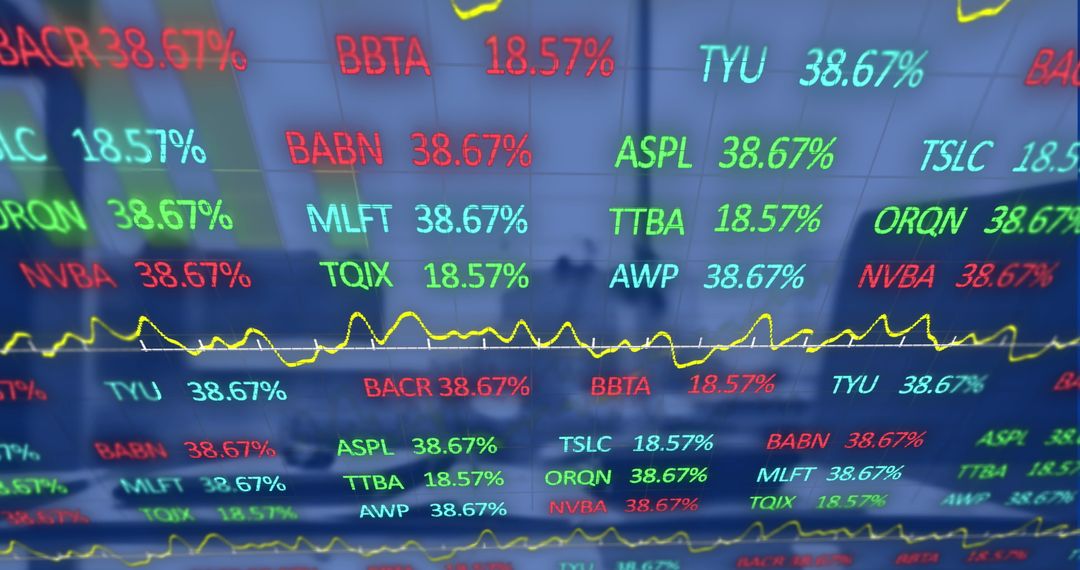
- Dynamic Visual of Financial Market Analytics Dashboard
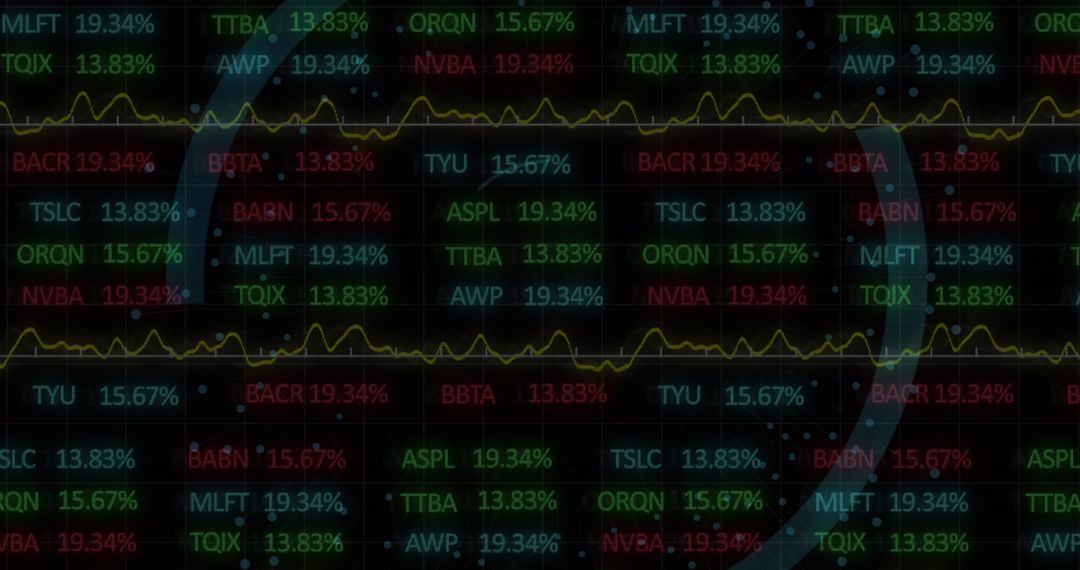
Dynamic Visual of Financial Market Analytics Dashboard Image
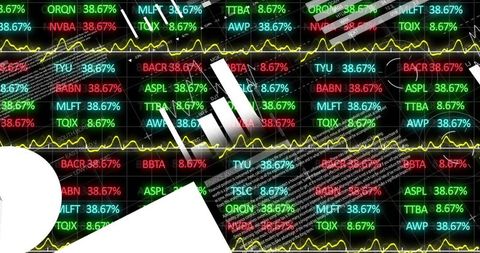
Showcasing dynamic representations of stock ticker symbols and percentage values interspersed with yellow trend lines. Great for illustrating concepts related to financial analytics, modern digital dashboards, and data-driven investment strategies. Ideal for blogs, educational materials, and presentations on technology in finance.
Powered by  - Get 15% off with code: PIKWIZARD15


2
downloads
downloads
Tags:
More
Credit Photo
If you would like to credit the Photo, here are some ways you can do so
Text Link
photo Link
<span class="text-link">
<span>
<a target="_blank" href=https://pikwizard.com/photo/dynamic-visual-of-financial-market-analytics-dashboard/8399f7d7e77189e462168a324abf462e/>PikWizard</a>
</span>
</span>
<span class="image-link">
<span
style="margin: 0 0 20px 0; display: inline-block; vertical-align: middle; width: 100%;"
>
<a
target="_blank"
href="https://pikwizard.com/photo/dynamic-visual-of-financial-market-analytics-dashboard/8399f7d7e77189e462168a324abf462e/"
style="text-decoration: none; font-size: 10px; margin: 0;"
>
<img src="https://pikwizard.com/pw/medium/8399f7d7e77189e462168a324abf462e.jpg" style="margin: 0; width: 100%;" alt="" />
<p style="font-size: 12px; margin: 0;">PikWizard</p>
</a>
</span>
</span>
Free (free of charge)
Free for personal and commercial use.
Author: People Creations
Similar Free Stock Images

Premium


Premium


Premium


Premium


Premium


Premium


Premium


Premium


Premium


Premium


Premium


Premium


Premium


Premium


Premium


Premium


Premium


Premium


Premium


Premium


Premium


Premium


Premium


Premium

