1. Home > 
  2. Stock Photos > 
  3. Dynamic Visualization of Data Processing with Numbers

Dynamic Visualization of Data Processing with Numbers Image

Dynamic Visualization of Data Processing with Numbers

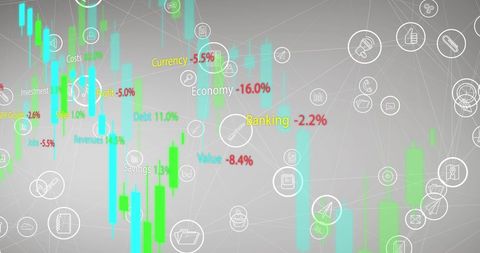
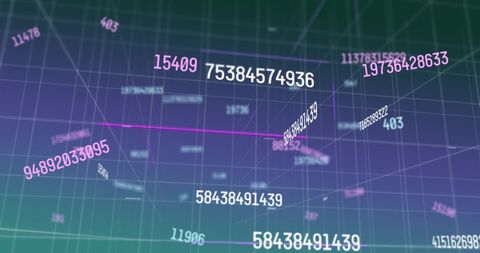
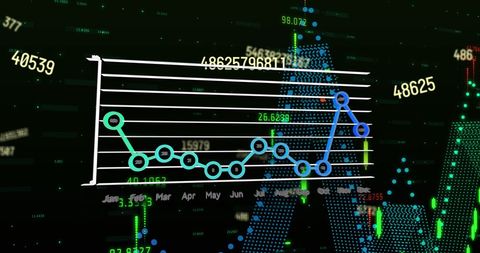
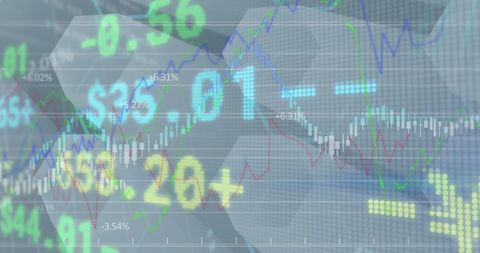
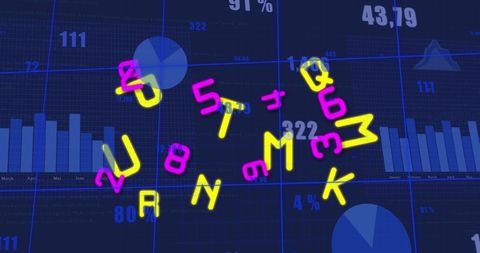
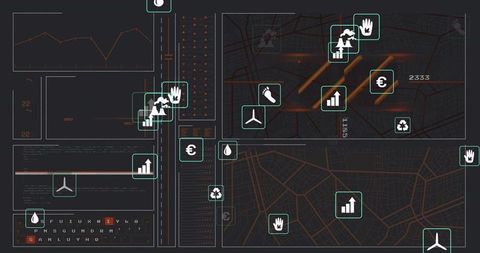
Various numbers and symbols are featured over a digital network, representing data processing and computing concepts. Useful for illustrating global financial analytics, statistical analysis concepts, or themes in mathematics and technology.

Powered by Shutterstock logo - Get 15% off with code: PIKWIZARD15
Team work process Business team use calculator to calculate figures, business statistics, profit, cost analysis, growth rate graph document. Data charts on the desk. - Powered by Shutterstock - Get 15% off with code: PIKWIZARD15Team work process Business team use calculator to calculate figures, business statistics, profit, cost analysis, growth rate graph document. Data charts on the desk. - Powered by Shutterstock - Get 15% off with code: PIKWIZARD15Image of statistics and data processing over biracial basketball player. Sports, competition, data processing and communication concept digitally generated image. - Powered by Shutterstock - Get 15% off with code: PIKWIZARD15Magnifying Glass Focusing on Qualitative and Quantitative Text Blocks Representing Research Methods and Data Analysis - Powered by Shutterstock - Get 15% off with code: PIKWIZARD15Statistical data processing against screens with mathematical equations on black background. statistics and mathematics research technology concept - Powered by Shutterstock - Get 15% off with code: PIKWIZARD15

Credit Photo

If you would like to credit the Photo, here are some ways you can do so

Free (free of charge)

Free for personal and commercial use.

Author: Awesome Content

Similar Free Stock Images

Abstract Data Visualization on Purple Background
Premium
Team work process Business team use calculator to calculate figures, business statistics, profit, cost analysis, growth rate graph document. Data charts on the desk.
Futuristic Neon Financial Dashboard with Candlestick Chart, Purple Cyan Bars and HUD
Financial Data Analysis with Bitcoin and Dollar Signs on Blue Background
Futuristic Infographic Commissioning Data Analysis with Graphics
Visuals Exploring Business Analytics and Digital Connectivity
Premium
Multiple changing numbers over statistical data processing against tall buildings in background. global finance and business concept
Dynamic Financial Data Graph Visualization on Black Background
Digital Financial Analysis with Mathematical Equations
Cyber Monday Digital Network Interface Illustration
Futuristic Geometric Patterns with Digital Circuits
Premium
team work process Business team use calculator to calculate figures, business statistics, profit, cost analysis, growth rate graph document. data charts on the desk
Futuristic Social Media and Stock Market Interface Design
Digital Network and Data Visualization Over Cityscape
Question Marks Hovering Over Digital Data Network
Digital Network Connection With Coding Symbols
Premium
Industrial Control Room Operator Monitoring Multiple Data Screens - Precision in Industrial Process Management and Automation for Operational Excellence. SCADA system in central heating process.
Digital Data Processing with Percentage Symbols and Numeric Codes
Premium
Image of numbers and data processing over diverse people working in warehouse. Global shipping, business, finance, computing and data processing concept digitally generated image.
Futuristic Global Data Analysis on Digital World Map
Abstract Digital Interface with Data Streams and Network Connections
Futuristic Business Technology Interface with Graphs and Icons
Displaying neon energy dashboard with glowing cyan bars and teal renewable icons
Premium
Image of changing numbers and statistical data processing against aerial view of cityscape. Global networking and business technology concept
Futuristic Digital Matrix with Floating Numbers and Symbols
Abstract Digital Network Icons Symbolizing Connectivity
Digital Virus Concept with Cybersecurity Imagery and Data Symbols
Premium
Accountant or banker working process, a Businesswoman using a calculator to calculate the numbers of statistic business profits growth rate on documents graph data, his desk in an office.
Premium
Teamwork process, Business team using a calculator to calculate the numbers of statistic business profits growth rate on documents graph data, desk in the office.
Premium
Teamwork process, Business team using a calculator to calculate the numbers of statistic business profits growth rate on documents graph data, desk in the office.
Premium
Big Data Analytics Concept, Data Processing and Analysis.
Global Financial Data Analysis with World Map and Bar Graphs
Kick Text and Digital Interface Icons on Blue Abstract Background
Premium
Mathematical equations floating over statistical data processing on grey background. statistics and mathematics research technology concept
Data Visualization with Finance Icons and Chart Streamlines
Futuristic Network Technology and Data Analysis Visualization
Floating Numbers in Digital Grid Network
Abstract Digital Financial Data Network Concept
Digital Network Data Analysis with Graphs and Percentages
Futuristic Data Visualization with Sine Wave and Digital Elements
Global AI Network with Scientific Equations and Graphics
Floating neon finance and eco icons over blue and pink analytics dashboard trending data
Digital Data Processing Over World Map with Global Connections
Premium
Image of financial data processing over caucasian businessman. business, digital interface and data processing concept digitally generated image.
Financial Data Processing Visualization on Digital Interface
Conceptual Digital Network with Scientific Data Processing
Advanced Scientific Formula Projections on Dark Background
Abstract Global Network and Data Interface Design
Abstract Data Network with Graph Analytics and User Profiles
Futuristic Healthcare Technology with Digital Network Connections
Organic Vegan Symbol with Futuristic Digital Background
Stock Market Analysis with Globe and Trend Graphs
Premium
Image of numbers and data processing over globes. Global data processing, business, finance and statistics concept digitally generated image.
Digital Stock Market Data with Financial Icons
Digital Interface of Security and Communication Icons on Purple Background
Abstract Network with Digital Connections and Data Points
Abstract Digital Interface with Geometric Patterns and Data Icons
Premium
Cognitive Data Processing: Human Brain Resting on a Vibrant Pile of Oversized Foam Numbers, Symbolizing Analytical Thinking and Complex Calculation.
Digital Interface Displaying COVID-19 Statistics Analysis and Trends
Digital Hologram of Graphs and Data Icons on Abstract Background
Data Overlay Over Clouds with Conceptual Networking Display
Futuristic Data Visualization with Financial Metrics
Complex Mathematical Equations on Digital Screen for Data Processing
Abstract Stock Market Data and Graphs Interface
Financial Data Analysis with Stock Market Trends and Graphs
Digital Financial Data on Grid
Innovative 5G Network Technology with Digital Interface
Abstract AI Concept with Geometric Patterns and Digital Brain
5G Technology Integration with Global Data Networks
Premium
Double exposure of virtual creative financial diagram on US flag and blue sky background, banking and accounting concept
Futuristic Wave and Digital Data on Black Background
Premium
Closeup view of electronic keypad highlighting the number seven button used for calculations
Abstract Data Visualisation with Hexagonal Patterns and Connections
5G Network Interface with Data Visualization Elements
Futuristic Digital Interface with Geometric Data Elements
Digital Global Network with Data Overlay on World Map
Premium
Teamwork process The Business team uses a calculator to calculate figures, business statistics, profit, cost analysis, and growth rate graph documents. data charts on the desk.
Dark Geospatial Analytics Dashboard Displaying Teal Icons, Orange Metrics and Grid Maps
Digital Interface with Financial Data on World Map
Abstract Data Projection with Numbers and Letters Over Blue Background
Digital Financial Data and Growth Analytics in Technology
Premium
Business people working together, diverse silhouettes and glowing digital business data analysis on virtual screen. Concept of conference and network
Email Communication Pathway on Digital Grid Background
Scientific Data Processing with Complex Formulas
Digital Network Diagram with Financial Data Symbols
Futuristic Holographic Data Dashboard Showing Analytics, Binary Code, Line Graphs, Icons
Premium
Image of mathematical data processing on blue background. Science and learning concept digitally generated image.
Sustainable Icons Overlay on Financial Data Analysis Concept
Displaying Futuristic HUD Network Interface with Hex Clusters and Connector Traces
Financial Data Concept with Graphs and Neon Text Elements
Financial Data Analytics Over Digital Display Interface
Neon Wireframe Truck and Trailer on Global HUD Grid for Fleet Logistics Visualization
Displaying neon data visualization dashboard with bar and line charts over Africa map
Interactive Data Analysis with Virtual Avatars and Visual Elements
Abstract Circuit Board on Blue Background with Data Icons
Futuristic 6G Concept with Digital Network Interface
Premium
Businessperson analyzing interactive digital dashboard with bar charts, pie graphs, and data visualizations, representing performance tracking, financial reports, and smart analytics.
Premium
Image of statistical data processing and mathematical equations against blue background. Business data and research science technology concept
Financial Data Merging with Stock Market Graph Technology
Digital Cryptocurrency Data on Global Network Map
Digital Security Interface with Fingerprint and Code
Premium
Image of statistical data processing against close up of a barrel at a factory. Beer production and brewing industry concept
Digital Network of Connections with Interactive Icons
Futuristic Financial Chart with Animated Numbers and Neon Highlights
Floating Numbers Over Cityscape Representing Statistical Analysis
Floating Numbers on Digital Grid Background
Premium
Image of statistics and data processing over african american basketball player. Sports, competition, data processing and communication concept digitally generated image.
Abstract Financial Data Processing on Dark Grid Background
Dynamic Data Overlay with Futuristic Digital Interface
Futuristic Digital World Map with Data Analysis and Connectivity
Premium
Image of mathematical data processing over black chalkboard. Global science, computing and data processing concept digitally generated image.
Digital Connectivity Network on Global Graph Background
Global Eco Icons Data Processing Over World Map
Futuristic Network Dashboard Showing Hex Cluster Mapping and Candlestick Trading Analytics
Futuristic 6G Technology Concept with Data Visualization
Digital World Map Overlapping Business Concept Texts and City Lights
Dynamic Stock Market Visualization on Digital Trading Board
Bitcoin Volatility Amid Geopolitical Tension
Futuristic Network with Digital Data Interface for Technology Applications
Digital Data Visualization with Financial Analytics and Metrics
Digital Analysis with Line Graph and Business Icons
Digital Finance and Cryptocurrency Statistics Visualization
Digital Network Connections and Data Analytics Interface Concept
Premium
Teamwork process, Business team using a calculator to calculate the numbers of statistic business profits growth rate on documents graph data, desk in the office.
Explore More Free Stock Images