
- Home >
- Stock Photos >
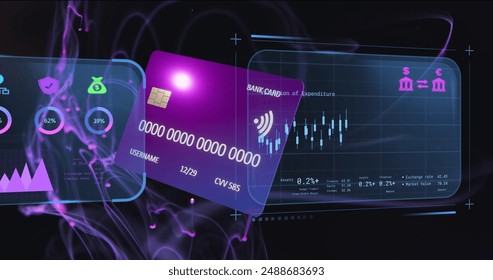
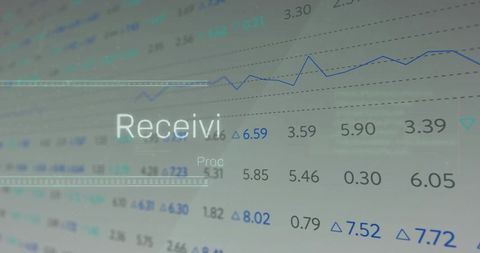
- Dynamic Visualization of Financial Data on Digital Interface
Dynamic Visualization of Financial Data on Digital Interface Image

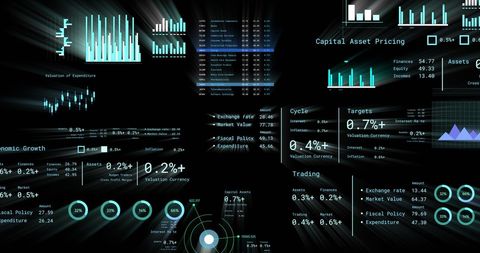
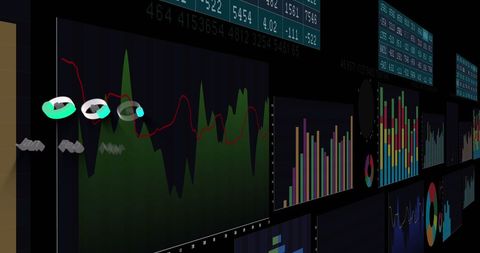
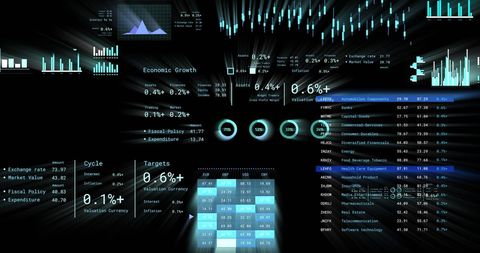
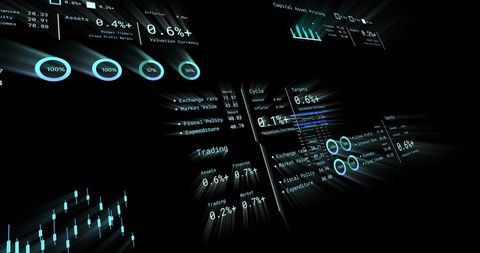
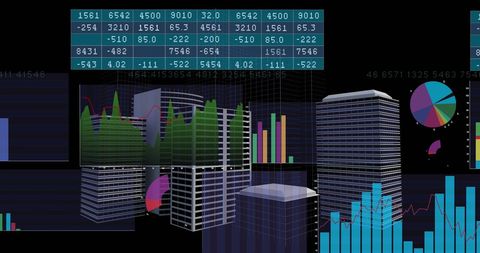
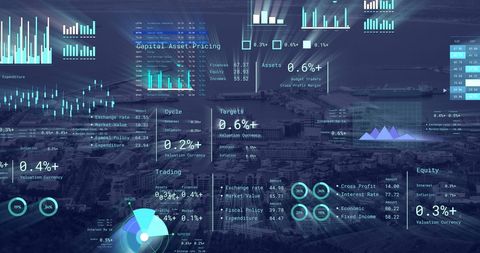
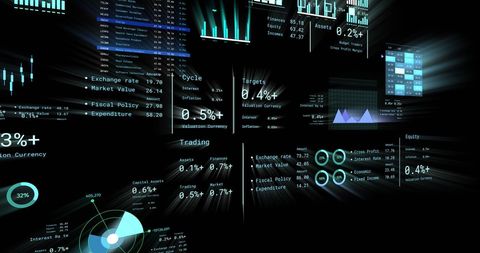
Dynamic visualization displaying financial data metrics on a digital interface, ideal for illustrating data analysis, business strategy, and finance-related content. Useful for articles, websites, and presentations requiring representation of advanced computing in business strategies.
Powered by  - Get 15% off with code: PIKWIZARD15


downloads
Tags:
More
Credit Photo
If you would like to credit the Photo, here are some ways you can do so
Text Link
photo Link
<span class="text-link">
<span>
<a target="_blank" href=https://pikwizard.com/photo/dynamic-visualization-of-financial-data-on-digital-interface/3113fc408acc6d6510034833c5af275d/>PikWizard</a>
</span>
</span>
<span class="image-link">
<span
style="margin: 0 0 20px 0; display: inline-block; vertical-align: middle; width: 100%;"
>
<a
target="_blank"
href="https://pikwizard.com/photo/dynamic-visualization-of-financial-data-on-digital-interface/3113fc408acc6d6510034833c5af275d/"
style="text-decoration: none; font-size: 10px; margin: 0;"
>
<img src="https://pikwizard.com/pw/medium/3113fc408acc6d6510034833c5af275d.jpg" style="margin: 0; width: 100%;" alt="" />
<p style="font-size: 12px; margin: 0;">PikWizard</p>
</a>
</span>
</span>
Free (free of charge)
Free for personal and commercial use.
Author: Authentic Images
Similar Free Stock Images

Premium

Premium

Premium


Premium


Premium


Premium


Premium


Premium

Premium

Premium

Premium


Premium


Premium


Premium


Premium


Premium


Premium


Premium


Premium


Premium


Premium


Premium


Premium


Premium


Premium


Explore More Free Stock Images